29
/
en
AIzaSyAYiBZKx7MnpbEhh9jyipgxe19OcubqV5w
April 1, 2024
101421
Canada
CAN
true
2
1
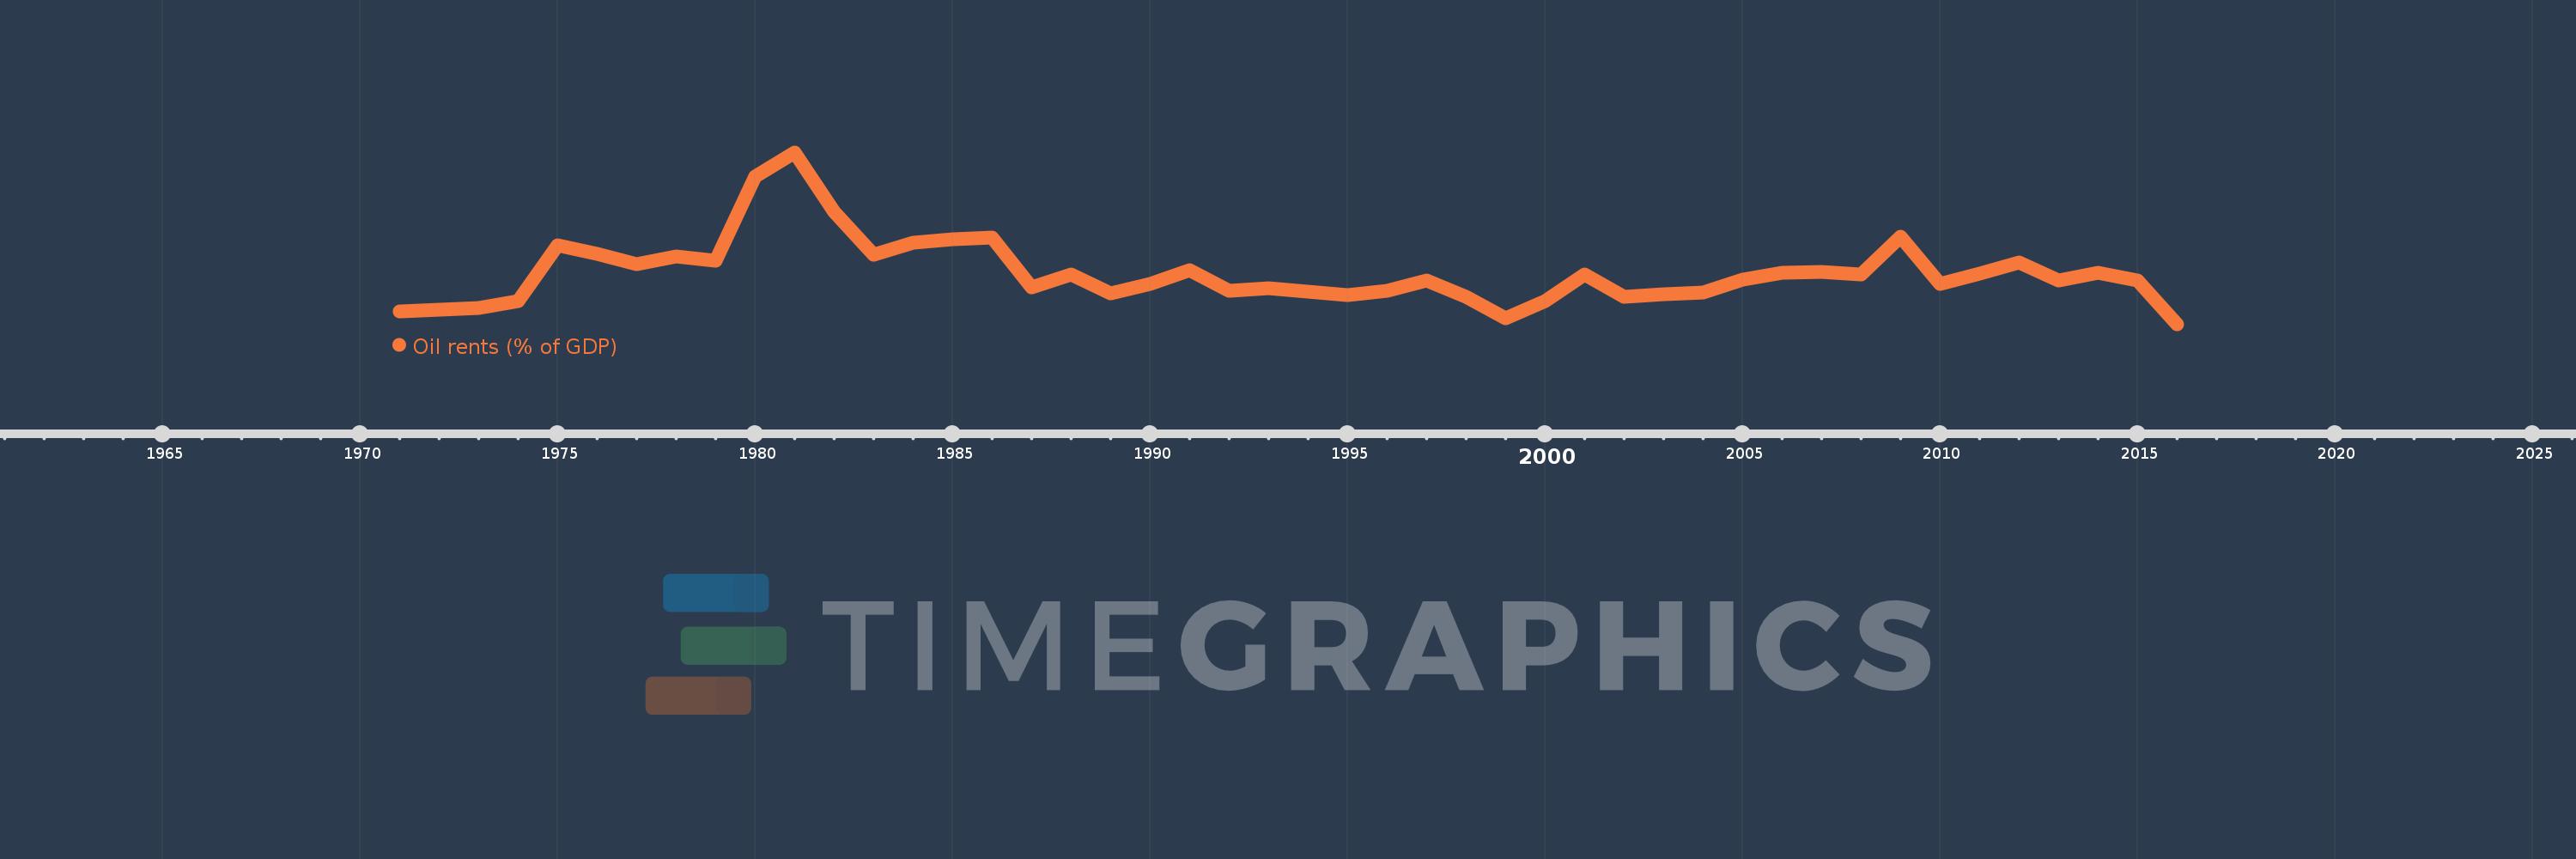
Oil rents (% of GDP)
2016,2015,2014,2013,2012,2011,2010,2009,2008,2007,2006,2005,2004,2003,2002,2001,2000,1999,1998,1997,1996,1995,1994,1993,1992,1991,1990,1989,1988,1987,1986,1985,1984,1983,1982,1981,1980,1979,1978,1977,1976,1975,1974,1973,1972,1971
This statistics in other country:
Timeline:
This timeline shows a graph from 1971 to 2016 of Canada. No data until 1970. Number of actual observations by date: 46.
Source name:
World Development Indicators
Source organization:
Estimates based on sources and methods described in "The Changing Wealth of Nations: Measuring Sustainable Development in the New Millennium" (World Bank, 2011).
Categories, topics:
Energy & Mining, Environment
Last updated:
apr 23, 2017
Indicators value changes by year
At the date of observation
Value
Absolute change
Change from previous value
jan 1, 1971
0.575
+0.575
0.0%
jan 1, 1972
0.615
+0.04
6.89%
jan 1, 1973
0.664
+0.049
8.02%
jan 1, 1974
0.85
+0.187
28.12%
jan 1, 1975
2.347
+1.496
175.91%
jan 1, 1976
2.132
-0.215
-9.15%
jan 1, 1977
1.856
-0.276
-12.93%
jan 1, 1978
2.066
+0.21
11.31%
jan 1, 1979
1.931
-0.135
-6.53%
jan 1, 1980
4.206
+2.275
117.79%
jan 1, 1981
4.87
+0.663
15.77%
jan 1, 1982
3.267
-1.602
-32.91%
jan 1, 1983
2.106
-1.161
-35.53%
jan 1, 1984
2.439
+0.332
15.77%
jan 1, 1985
2.521
+0.082
3.38%
jan 1, 1986
2.56
+0.039
1.54%
jan 1, 1987
1.218
-1.342
-52.44%
jan 1, 1988
1.567
+0.349
28.68%
jan 1, 1989
1.051
-0.516
-32.9%
jan 1, 1990
1.302
+0.251
23.88%
jan 1, 1991
1.683
+0.381
29.27%
jan 1, 1992
1.122
-0.561
-33.35%
jan 1, 1993
1.202
+0.08
7.16%
jan 1, 1994
1.113
-0.089
-7.41%
jan 1, 1995
1.015
-0.098
-8.8%
jan 1, 1996
1.126
+0.111
10.89%
jan 1, 1997
1.401
+0.275
24.39%
jan 1, 1998
0.965
-0.436
-31.13%
jan 1, 1999
0.381
-0.584
-60.5%
jan 1, 2000
0.842
+0.461
121.01%
jan 1, 2001
1.575
+0.733
87.02%
jan 1, 2002
0.973
-0.602
-38.22%
jan 1, 2003
1.026
+0.053
5.41%
jan 1, 2004
1.089
+0.063
6.17%
jan 1, 2005
1.425
+0.336
30.83%
jan 1, 2006
1.606
+0.181
12.7%
jan 1, 2007
1.649
+0.043
2.67%
jan 1, 2008
1.564
-0.084
-5.11%
jan 1, 2009
2.592
+1.028
65.71%
jan 1, 2010
1.303
-1.289
-49.74%
jan 1, 2011
1.586
+0.283
21.75%
jan 1, 2012
1.897
+0.311
19.61%
jan 1, 2013
1.397
-0.5
-26.37%
jan 1, 2014
1.625
+0.228
16.29%
jan 1, 2015
1.412
-0.213
-13.12%
jan 1, 2016
0.223
-1.188
-84.17%
Ranking of countries by current statistics by years


Comments: