29
/
en
AIzaSyAYiBZKx7MnpbEhh9jyipgxe19OcubqV5w
April 1, 2024
166588
Kazakhstan
KAZ
true
2
1
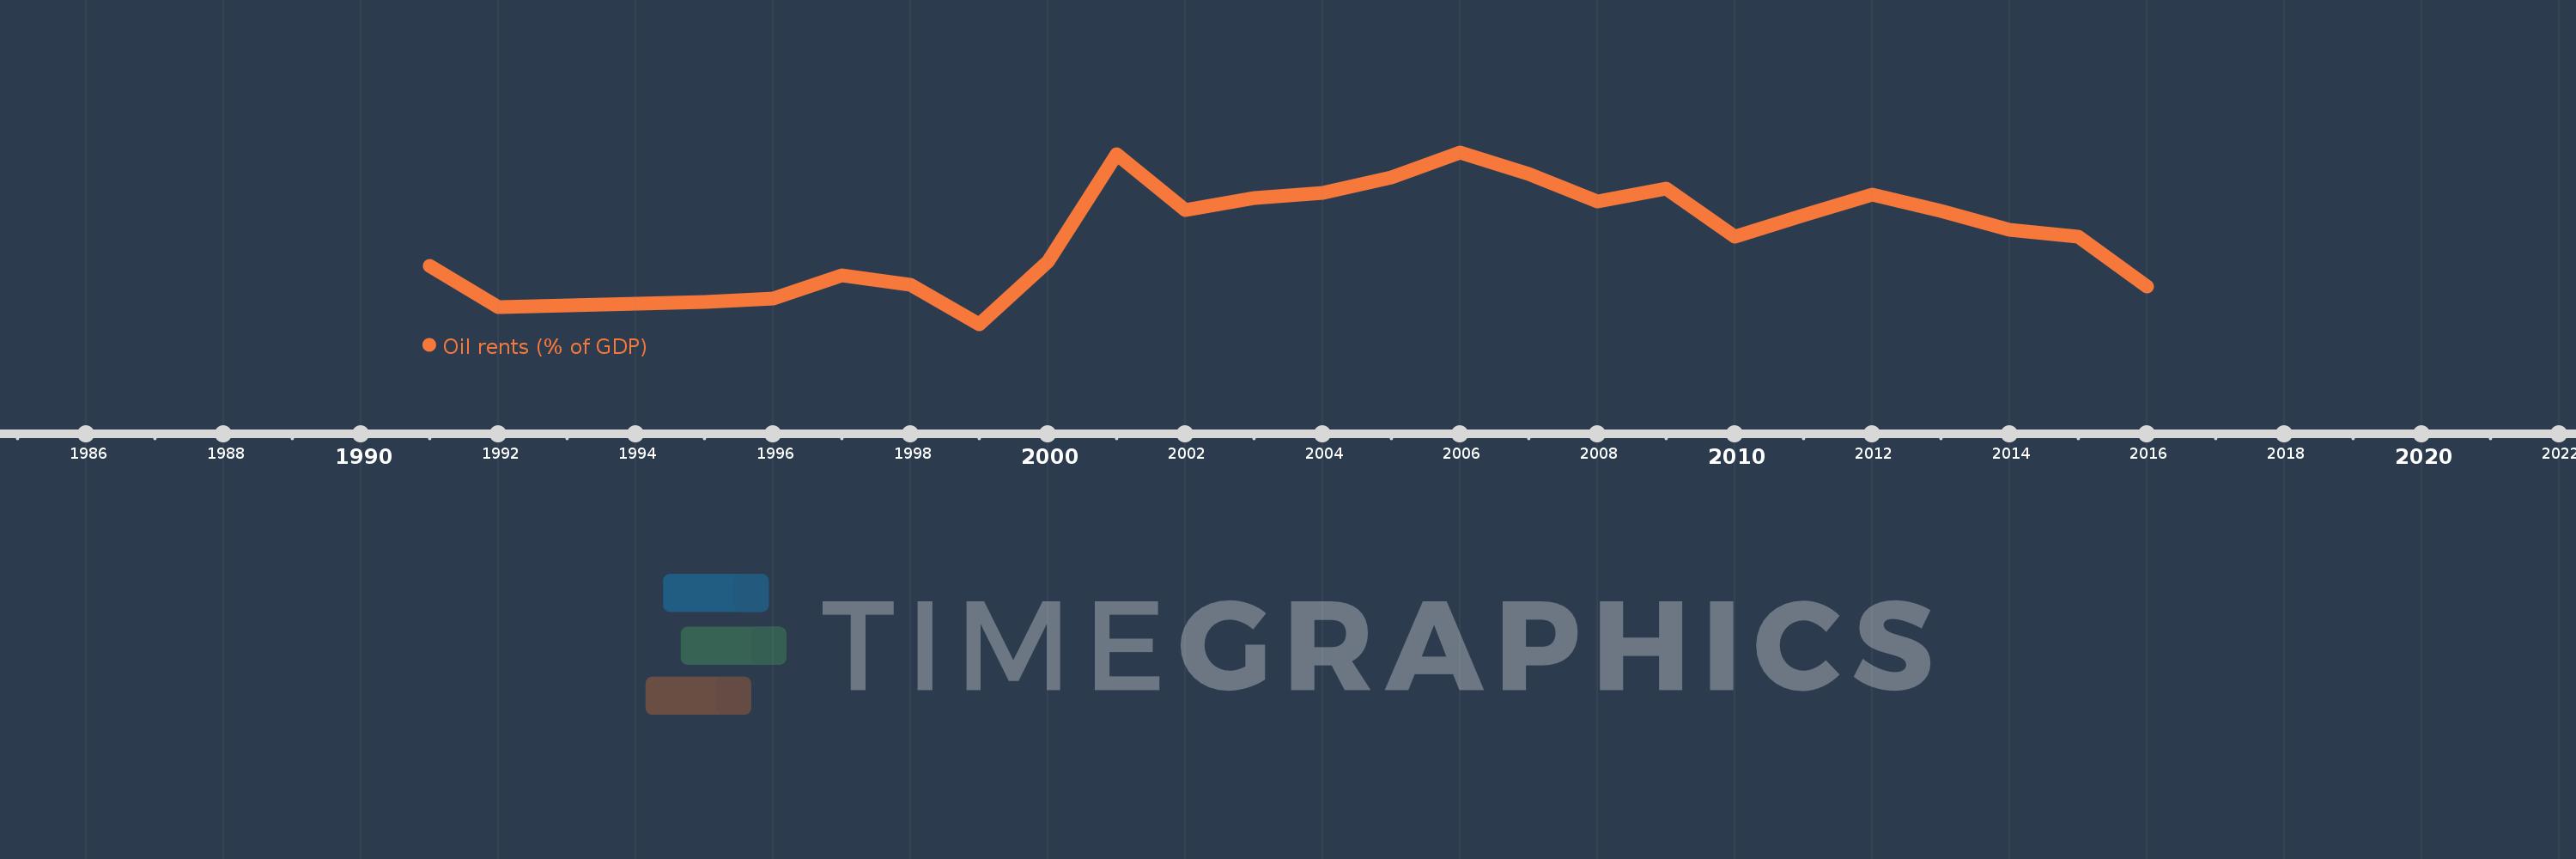
Oil rents (% of GDP)
2016,2015,2014,2013,2012,2011,2010,2009,2008,2007,2006,2005,2004,2003,2002,2001,2000,1999,1998,1997,1996,1995,1994,1993,1992,1991
This statistics in other country:
Timeline:
This timeline shows a graph from 1991 to 2016 of Kazakhstan. No data until 1990. Number of actual observations by date: 26.
Source name:
World Development Indicators
Source organization:
Estimates based on sources and methods described in "The Changing Wealth of Nations: Measuring Sustainable Development in the New Millennium" (World Bank, 2011).
Categories, topics:
Energy & Mining, Environment
Last updated:
apr 23, 2017
Indicators value changes by year
Maximum:
20.979
jan 1, 2006
At the date of observation
Value
Absolute change
Change from previous value
jan 1, 1991
7.991
+7.991
0.0%
jan 1, 1992
3.212
-4.78
-59.81%
jan 1, 1993
3.461
+0.249
7.76%
jan 1, 1994
3.617
+0.156
4.5%
jan 1, 1995
3.8
+0.184
5.08%
jan 1, 1996
4.26
+0.46
12.1%
jan 1, 1997
6.922
+2.662
62.49%
jan 1, 1998
5.767
-1.155
-16.69%
jan 1, 1999
1.298
-4.469
-77.49%
jan 1, 2000
8.437
+7.138
549.79%
jan 1, 2001
20.777
+12.341
146.27%
jan 1, 2002
14.418
-6.359
-30.6%
jan 1, 2003
15.705
+1.287
8.92%
jan 1, 2004
16.374
+0.668
4.26%
jan 1, 2005
18.124
+1.75
10.69%
jan 1, 2006
20.979
+2.855
15.75%
jan 1, 2007
18.462
-2.517
-12.0%
jan 1, 2008
15.334
-3.128
-16.94%
jan 1, 2009
16.824
+1.49
9.71%
jan 1, 2010
11.35
-5.474
-32.54%
jan 1, 2011
13.813
+2.462
21.69%
jan 1, 2012
16.13
+2.318
16.78%
jan 1, 2013
14.248
-1.883
-11.67%
jan 1, 2014
12.135
-2.113
-14.83%
jan 1, 2015
11.297
-0.838
-6.91%
jan 1, 2016
5.612
-5.685
-50.32%
Ranking of countries by current statistics by years


Comments: