29
/
en
AIzaSyAYiBZKx7MnpbEhh9jyipgxe19OcubqV5w
April 1, 2024
52127
North America
NAC
false
2
1
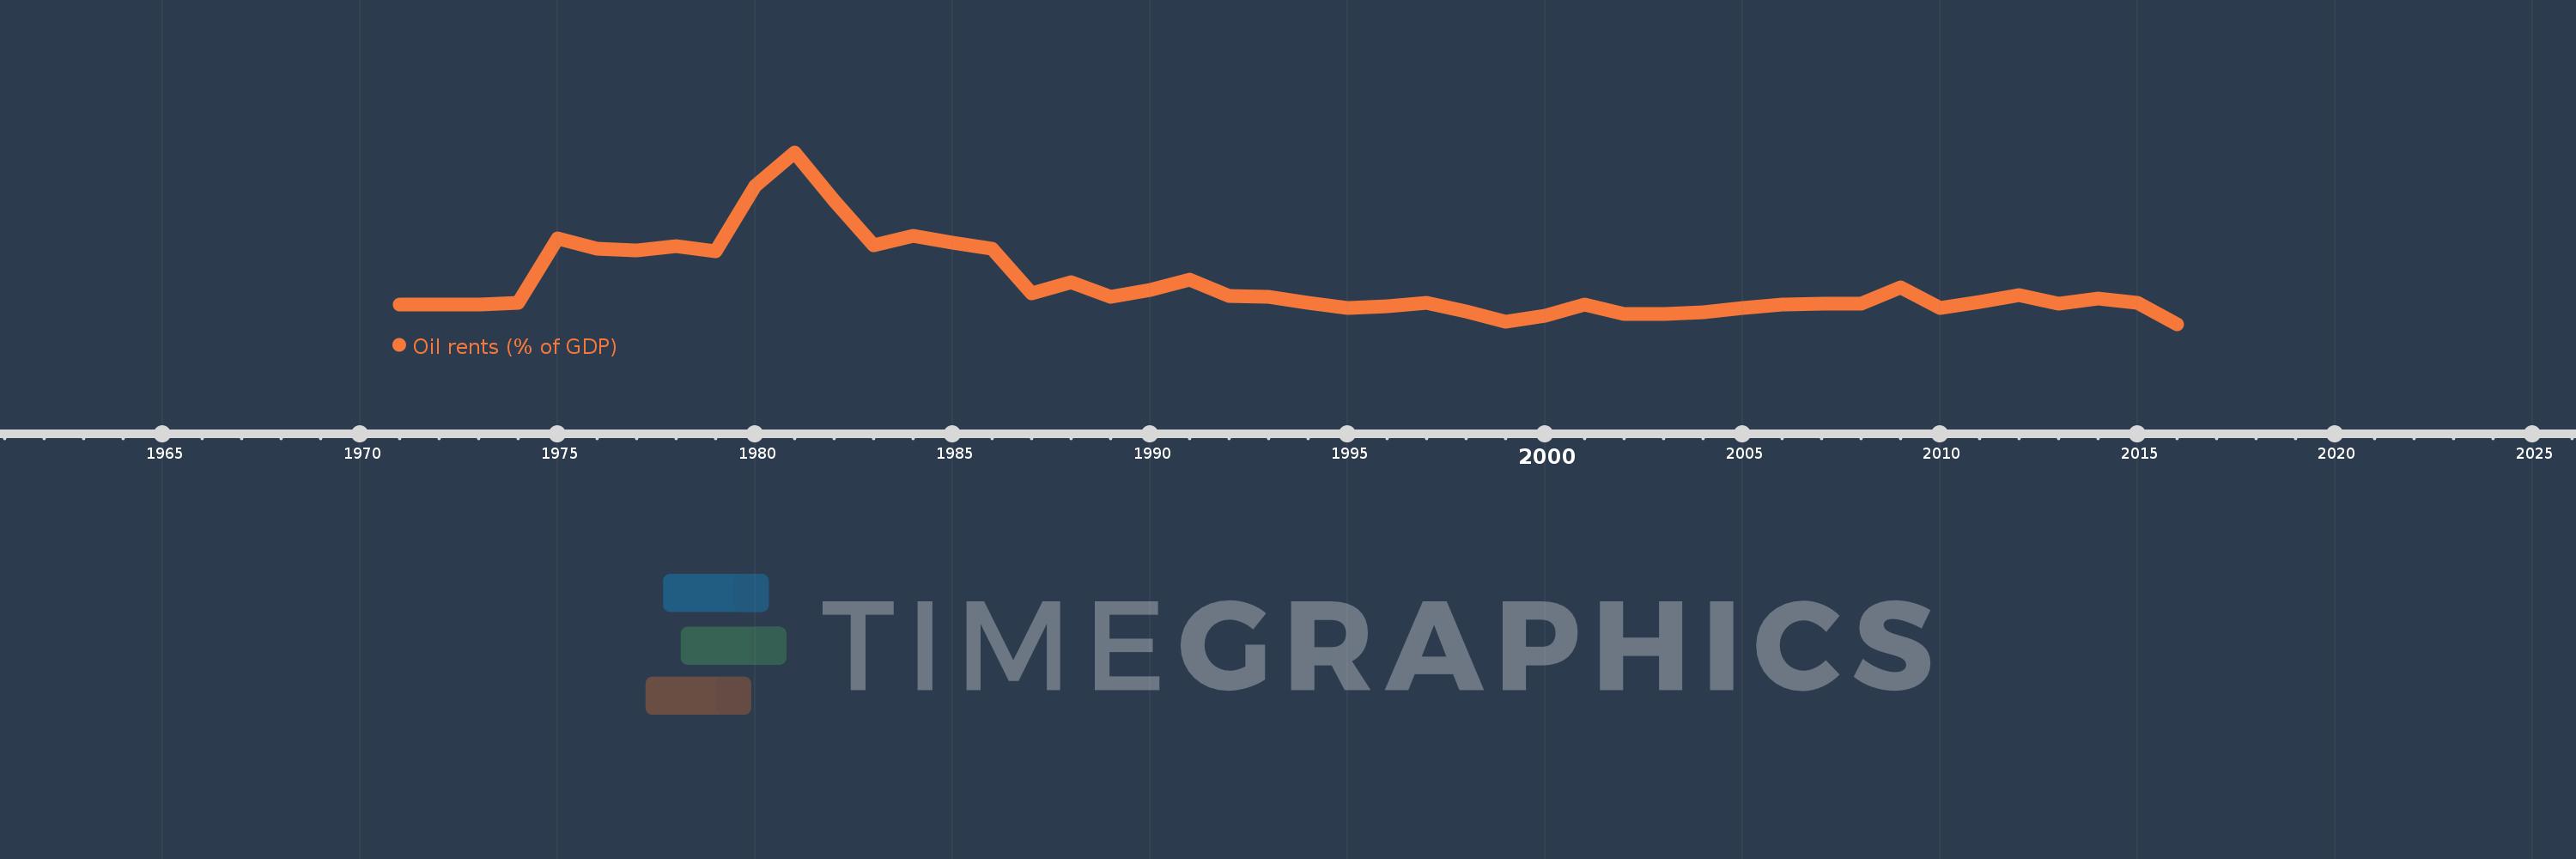
Oil rents (% of GDP)
2016,2015,2014,2013,2012,2011,2010,2009,2008,2007,2006,2005,2004,2003,2002,2001,2000,1999,1998,1997,1996,1995,1994,1993,1992,1991,1990,1989,1988,1987,1986,1985,1984,1983,1982,1981,1980,1979,1978,1977,1976,1975,1974,1973,1972,1971
This statistics in other country:
Timeline:
This timeline shows a graph from 1971 to 2016 of North America. No data until 1970. Number of actual observations by date: 46.
Source name:
World Development Indicators
Source organization:
Estimates based on sources and methods described in "The Changing Wealth of Nations: Measuring Sustainable Development in the New Millennium" (World Bank, 2011).
Categories, topics:
Energy & Mining, Environment
Last updated:
apr 23, 2017
Indicators value changes by year
At the date of observation
Value
Absolute change
Change from previous value
jan 1, 1971
0.424
+0.424
0.0%
jan 1, 1972
0.416
-0.007
-1.66%
jan 1, 1973
0.416
-0.001
-0.22%
jan 1, 1974
0.459
+0.044
10.51%
jan 1, 1975
1.625
+1.166
253.81%
jan 1, 1976
1.436
-0.189
-11.62%
jan 1, 1977
1.399
-0.037
-2.61%
jan 1, 1978
1.476
+0.078
5.54%
jan 1, 1979
1.394
-0.082
-5.57%
jan 1, 1980
2.582
+1.188
85.19%
jan 1, 1981
3.189
+0.607
23.51%
jan 1, 1982
2.317
-0.872
-27.35%
jan 1, 1983
1.507
-0.809
-34.93%
jan 1, 1984
1.675
+0.167
11.11%
jan 1, 1985
1.542
-0.133
-7.91%
jan 1, 1986
1.441
-0.101
-6.57%
jan 1, 1987
0.622
-0.819
-56.85%
jan 1, 1988
0.832
+0.21
33.73%
jan 1, 1989
0.565
-0.266
-32.0%
jan 1, 1990
0.693
+0.127
22.52%
jan 1, 1991
0.875
+0.182
26.25%
jan 1, 1992
0.584
-0.29
-33.19%
jan 1, 1993
0.555
-0.029
-4.97%
jan 1, 1994
0.447
-0.109
-19.56%
jan 1, 1995
0.365
-0.081
-18.18%
jan 1, 1996
0.384
+0.019
5.19%
jan 1, 1997
0.455
+0.07
18.29%
jan 1, 1998
0.294
-0.161
-35.45%
jan 1, 1999
0.103
-0.191
-64.95%
jan 1, 2000
0.22
+0.117
113.74%
jan 1, 2001
0.415
+0.195
88.61%
jan 1, 2002
0.242
-0.173
-41.63%
jan 1, 2003
0.249
+0.007
3.05%
jan 1, 2004
0.279
+0.03
11.85%
jan 1, 2005
0.365
+0.086
30.84%
jan 1, 2006
0.427
+0.062
16.9%
jan 1, 2007
0.438
+0.011
2.63%
jan 1, 2008
0.433
-0.005
-1.19%
jan 1, 2009
0.736
+0.303
70.03%
jan 1, 2010
0.365
-0.371
-50.4%
jan 1, 2011
0.472
+0.107
29.32%
jan 1, 2012
0.596
+0.124
26.18%
jan 1, 2013
0.444
-0.151
-25.43%
jan 1, 2014
0.527
+0.083
18.72%
jan 1, 2015
0.454
-0.074
-13.95%
jan 1, 2016
0.063
-0.391
-86.13%
Ranking of countries by current statistics by years


Comments: