29
/
en
AIzaSyAYiBZKx7MnpbEhh9jyipgxe19OcubqV5w
April 1, 2024
285045
Yemen, Rep.
YEM
true
2
1
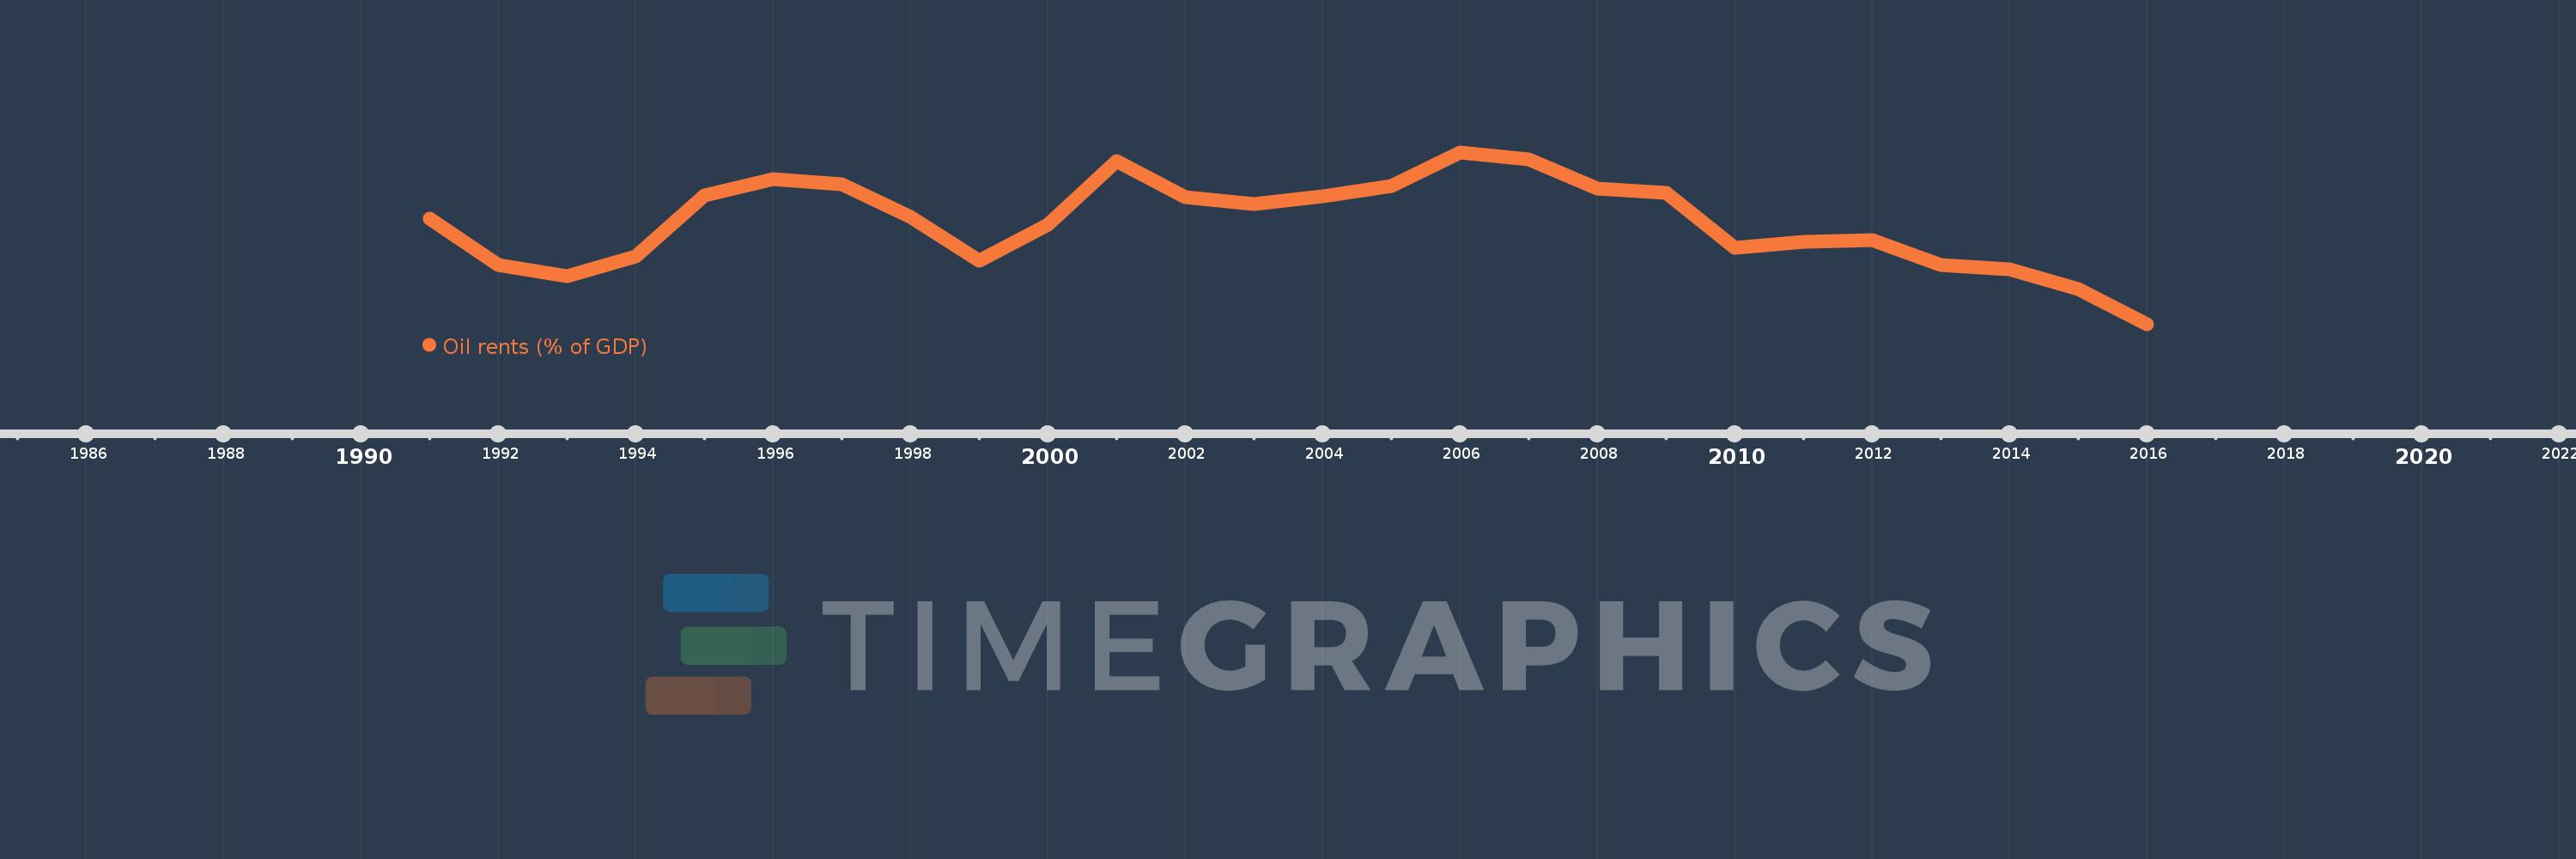
Oil rents (% of GDP)
2016,2015,2014,2013,2012,2011,2010,2009,2008,2007,2006,2005,2004,2003,2002,2001,2000,1999,1998,1997,1996,1995,1994,1993,1992,1991
This statistics in other country:
Timeline:
This timeline shows a graph from 1991 to 2016 of Yemen, Rep.. No data until 1990. Number of actual observations by date: 26.
Source name:
World Development Indicators
Source organization:
Estimates based on sources and methods described in "The Changing Wealth of Nations: Measuring Sustainable Development in the New Millennium" (World Bank, 2011).
Categories, topics:
Energy & Mining, Environment
Last updated:
apr 23, 2017
Indicators value changes by year
At the date of observation
Value
Absolute change
Change from previous value
jan 1, 1991
25.675
+25.675
0.0%
jan 1, 1992
15.208
-10.467
-40.77%
jan 1, 1993
12.73
-2.478
-16.29%
jan 1, 1994
17.237
+4.507
35.4%
jan 1, 1995
31.035
+13.798
80.05%
jan 1, 1996
34.583
+3.548
11.43%
jan 1, 1997
33.416
-1.167
-3.37%
jan 1, 1998
26.165
-7.251
-21.7%
jan 1, 1999
16.282
-9.883
-37.77%
jan 1, 2000
24.315
+8.032
49.33%
jan 1, 2001
38.691
+14.377
59.13%
jan 1, 2002
30.546
-8.146
-21.05%
jan 1, 2003
28.94
-1.605
-5.26%
jan 1, 2004
30.84
+1.899
6.56%
jan 1, 2005
33.017
+2.177
7.06%
jan 1, 2006
40.67
+7.653
23.18%
jan 1, 2007
39.084
-1.586
-3.9%
jan 1, 2008
32.421
-6.663
-17.05%
jan 1, 2009
31.541
-0.88
-2.71%
jan 1, 2010
19.08
-12.462
-39.51%
jan 1, 2011
20.517
+1.437
7.53%
jan 1, 2012
20.961
+0.444
2.16%
jan 1, 2013
15.215
-5.746
-27.41%
jan 1, 2014
14.306
-0.91
-5.98%
jan 1, 2015
9.839
-4.467
-31.22%
jan 1, 2016
1.893
-7.946
-80.76%
Ranking of countries by current statistics by years


Comments: