29
/
en
AIzaSyAYiBZKx7MnpbEhh9jyipgxe19OcubqV5w
April 1, 2024
32930
Europe & Central Asia (IDA & IBRD countries)
TEC
false
2
1
Oil rents (% of GDP)
2016,2015,2014,2013,2012,2011,2010,2009,2008,2007,2006,2005,2004,2003,2002,2001,2000,1999,1998,1997,1996,1995,1994,1993,1992,1991,1990,1989,1988,1987,1986,1985,1984,1983,1982,1981,1980,1979,1978,1977,1976,1975,1974,1973,1972,1971
Download
Global statistics library →Europe & Central Asia (IDA & IBRD countries) →

Oil rents (% of GDP)

This statistics in other country:
AfghanistanAlbaniaAlgeriaAngolaArab WorldArgentinaArmeniaAustraliaAustriaAzerbaijanBahrainBangladeshBarbadosBelarusBelgiumBelizeBeninBoliviaBosnia and HerzegovinaBotswanaBrazilBrunei DarussalamBulgariaCambodiaCameroonCanadaCaribbean small statesCentral Europe and the BalticsChadChileChinaColombiaCongo, Dem. Rep.Congo, Rep.Costa RicaCote d'IvoireCroatiaCubaCyprusCzech RepublicDenmarkDominican RepublicEarly-demographic dividendEast Asia & PacificEast Asia & Pacific (excluding high income)East Asia & Pacific (IDA & IBRD countries)EcuadorEgypt, Arab Rep.El SalvadorEquatorial GuineaEritreaEstoniaEthiopiaEuro areaEurope & Central AsiaEurope & Central Asia (excluding high income)Europe & Central Asia (IDA & IBRD countries)European UnionFinlandFragile and conflict affected situationsFranceGabonGeorgiaGermanyGhanaGreeceGuatemalaHaitiHeavily indebted poor countries (HIPC)High incomeHondurasHungaryIBRD onlyIcelandIDA & IBRD totalIDA blendIDA onlyIDA totalIndiaIndonesiaIran, Islamic Rep.IraqIrelandIsraelItalyJamaicaJapanJordanKazakhstanKenyaKorea, Rep.KosovoKuwaitKyrgyz RepublicLate-demographic dividendLatin America & Caribbean Latin America & Caribbean (excluding high income)Latin America & the Caribbean (IDA & IBRD countries)LatviaLeast developed countries: UN classificationLebanonLibyaLithuaniaLow & middle incomeLower middle incomeLuxembourgMacedonia, FYRMalaysiaMaltaMauritaniaMauritiusMexicoMiddle East & North AfricaMiddle East & North Africa (excluding high income)Middle East & North Africa (IDA & IBRD countries)Middle incomeMongoliaMontenegroMoroccoMozambiqueMyanmarNamibiaNepalNetherlandsNew ZealandNicaraguaNigerNigeriaNorth AmericaNorwayOECD membersOmanOther small statesPakistanPanamaPapua New GuineaParaguayPeruPhilippinesPolandPortugalPost-demographic dividendPre-demographic dividendQatarRomaniaRussian FederationSaudi ArabiaSenegalSerbiaSingaporeSlovak RepublicSloveniaSmall statesSouth AfricaSouth AsiaSouth Asia (IDA & IBRD)South SudanSpainSri LankaSub-Saharan Africa Sub-Saharan Africa (excluding high income)Sub-Saharan Africa (IDA & IBRD countries)SudanSurinameSwedenSwitzerlandSyrian Arab RepublicTajikistanThailandTimor-LesteTogoTrinidad and TobagoTunisiaTurkeyTurkmenistanUkraineUnited Arab EmiratesUnited KingdomUnited StatesUpper middle incomeUruguayUzbekistanVenezuela, RBVietnamWest Bank and GazaWorldYemen, Rep.ZambiaZimbabwe
Timeline:
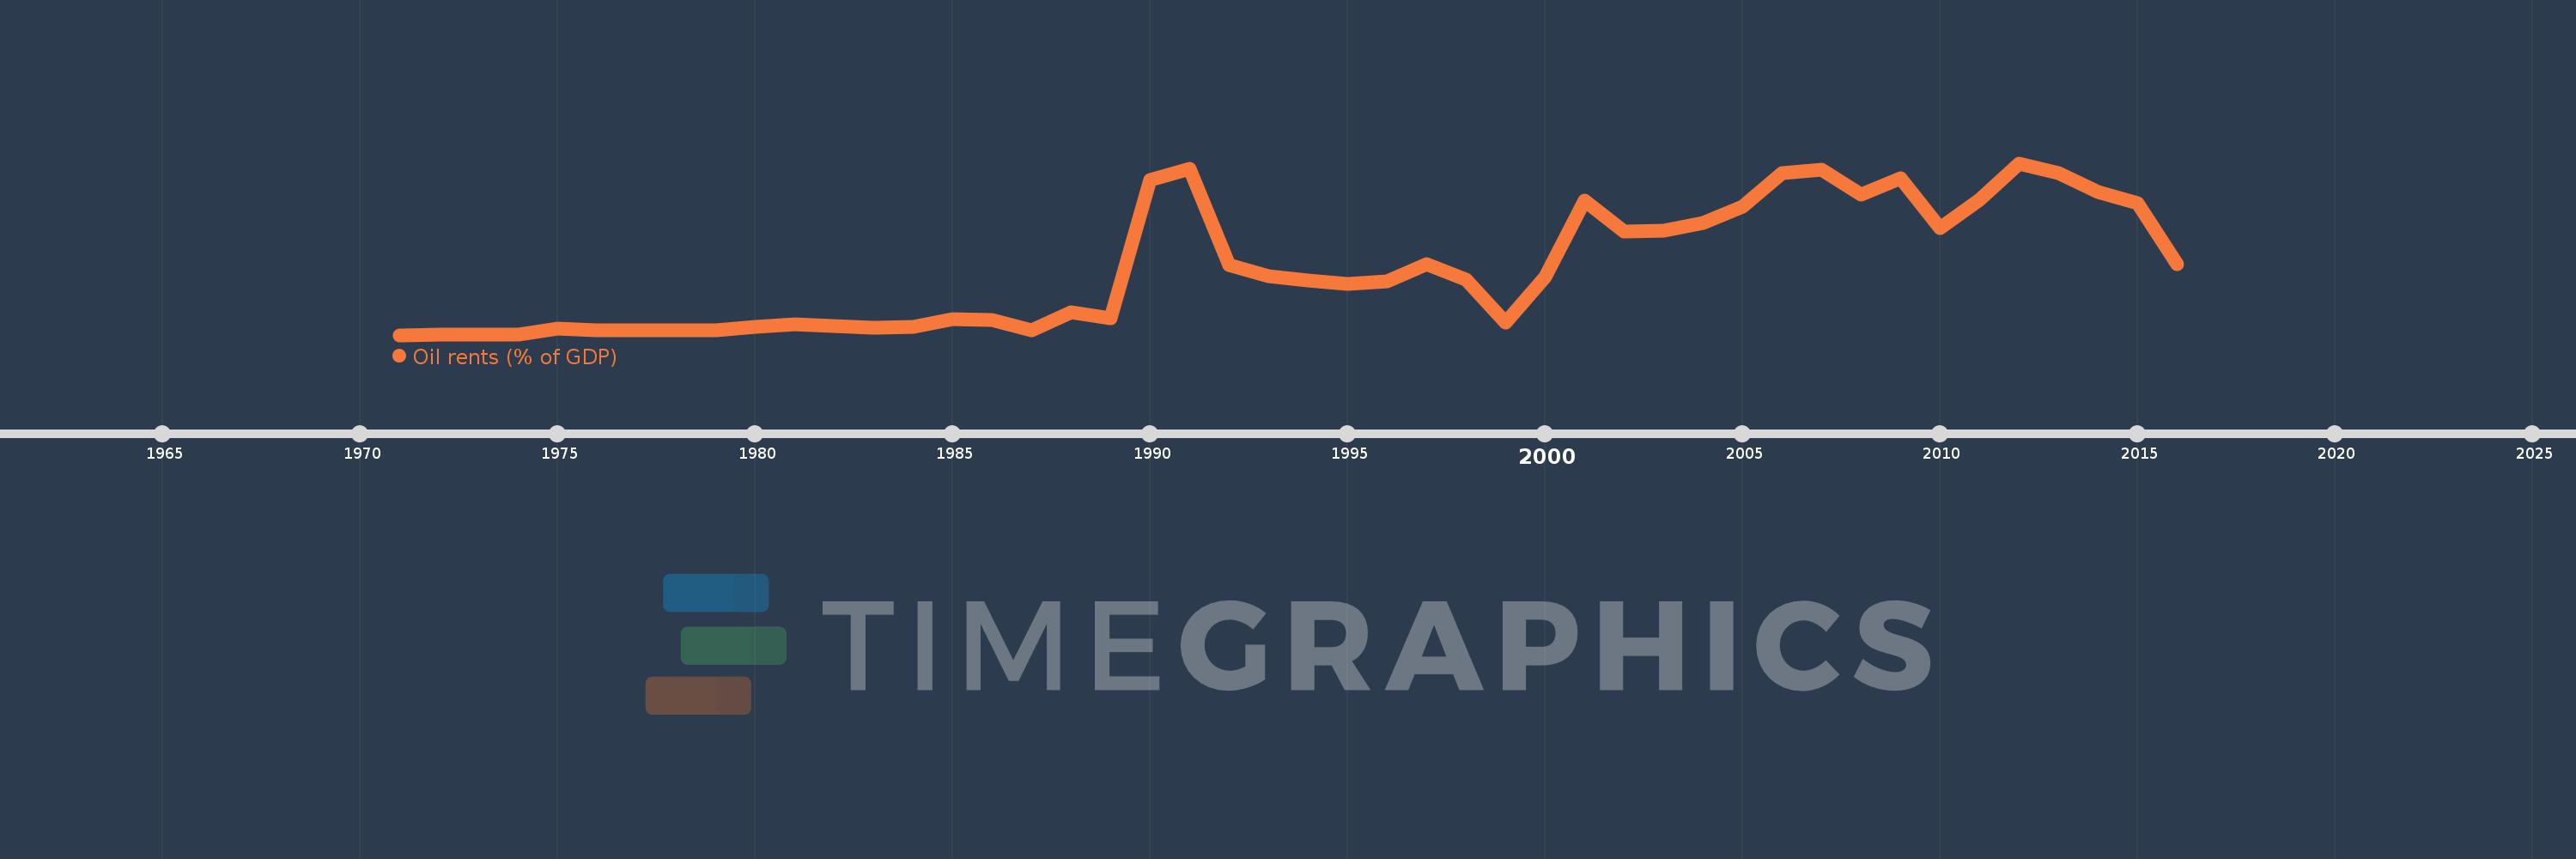
This timeline shows a graph from 1971 to 2016 of Europe & Central Asia (IDA & IBRD countries). No data until 1970. Number of actual observations by date: 46.
Source name:
World Development Indicators
Source organization:
Estimates based on sources and methods described in "The Changing Wealth of Nations: Measuring Sustainable Development in the New Millennium" (World Bank, 2011).
Categories, topics:
Energy & Mining, Environment
Last updated:
apr 23, 2017
Indicators value changes by year
Mean:
2.603
Minimum:
0.004
jan 1, 1971
Maximum:
6.678
jan 1, 2012
At the date of observation
Value
Absolute change
Change from previous value
jan 1, 1971
0.004
+0.004
0.0%
jan 1, 1972
0.007
+0.003
81.26%
jan 1, 1973
0.006
0.0
-7.38%
jan 1, 1974
0.008
+0.002
27.3%
jan 1, 1975
0.253
+0.245
3.19K%
jan 1, 1976
0.192
-0.06
-23.91%
jan 1, 1977
0.202
+0.01
5.14%
jan 1, 1978
0.193
-0.009
-4.55%
jan 1, 1979
0.172
-0.021
-10.88%
jan 1, 1980
0.324
+0.152
88.13%
jan 1, 1981
0.414
+0.09
27.93%
jan 1, 1982
0.343
-0.072
-17.29%
jan 1, 1983
0.286
-0.057
-16.59%
jan 1, 1984
0.313
+0.028
9.64%
jan 1, 1985
0.635
+0.322
102.62%
jan 1, 1986
0.572
-0.063
-9.89%
jan 1, 1987
0.202
-0.37
-64.71%
jan 1, 1988
0.902
+0.7
346.93%
jan 1, 1989
0.655
-0.247
-27.42%
jan 1, 1990
6.015
+5.36
818.47%
jan 1, 1991
6.447
+0.432
7.17%
jan 1, 1992
2.714
-3.733
-57.91%
jan 1, 1993
2.284
-0.43
-15.83%
jan 1, 1994
2.129
-0.155
-6.79%
jan 1, 1995
1.996
-0.133
-6.27%
jan 1, 1996
2.076
+0.08
4.03%
jan 1, 1997
2.75
+0.674
32.46%
jan 1, 1998
2.152
-0.598
-21.74%
jan 1, 1999
0.476
-1.676
-77.87%
jan 1, 2000
2.263
+1.787
375.24%
jan 1, 2001
5.215
+2.952
130.43%
jan 1, 2002
4.012
-1.203
-23.07%
jan 1, 2003
4.074
+0.062
1.54%
jan 1, 2004
4.356
+0.283
6.94%
jan 1, 2005
4.999
+0.643
14.75%
jan 1, 2006
6.28
+1.281
25.62%
jan 1, 2007
6.44
+0.16
2.55%
jan 1, 2008
5.476
-0.964
-14.96%
jan 1, 2009
6.089
+0.612
11.18%
jan 1, 2010
4.175
-1.913
-31.43%
jan 1, 2011
5.253
+1.077
25.81%
jan 1, 2012
6.678
+1.426
27.14%
jan 1, 2013
6.3
-0.378
-5.66%
jan 1, 2014
5.554
-0.746
-11.84%
jan 1, 2015
5.127
-0.427
-7.69%
jan 1, 2016
2.743
-2.384
-46.49%
Ranking of countries by current statistics by years

Comments:

Send
PremiumAbout & FeedbackTermsPrivacy
logo
© 2022 Selected Technologies LLC – Morgan Hill, California