This statistics in other country:
Timeline:
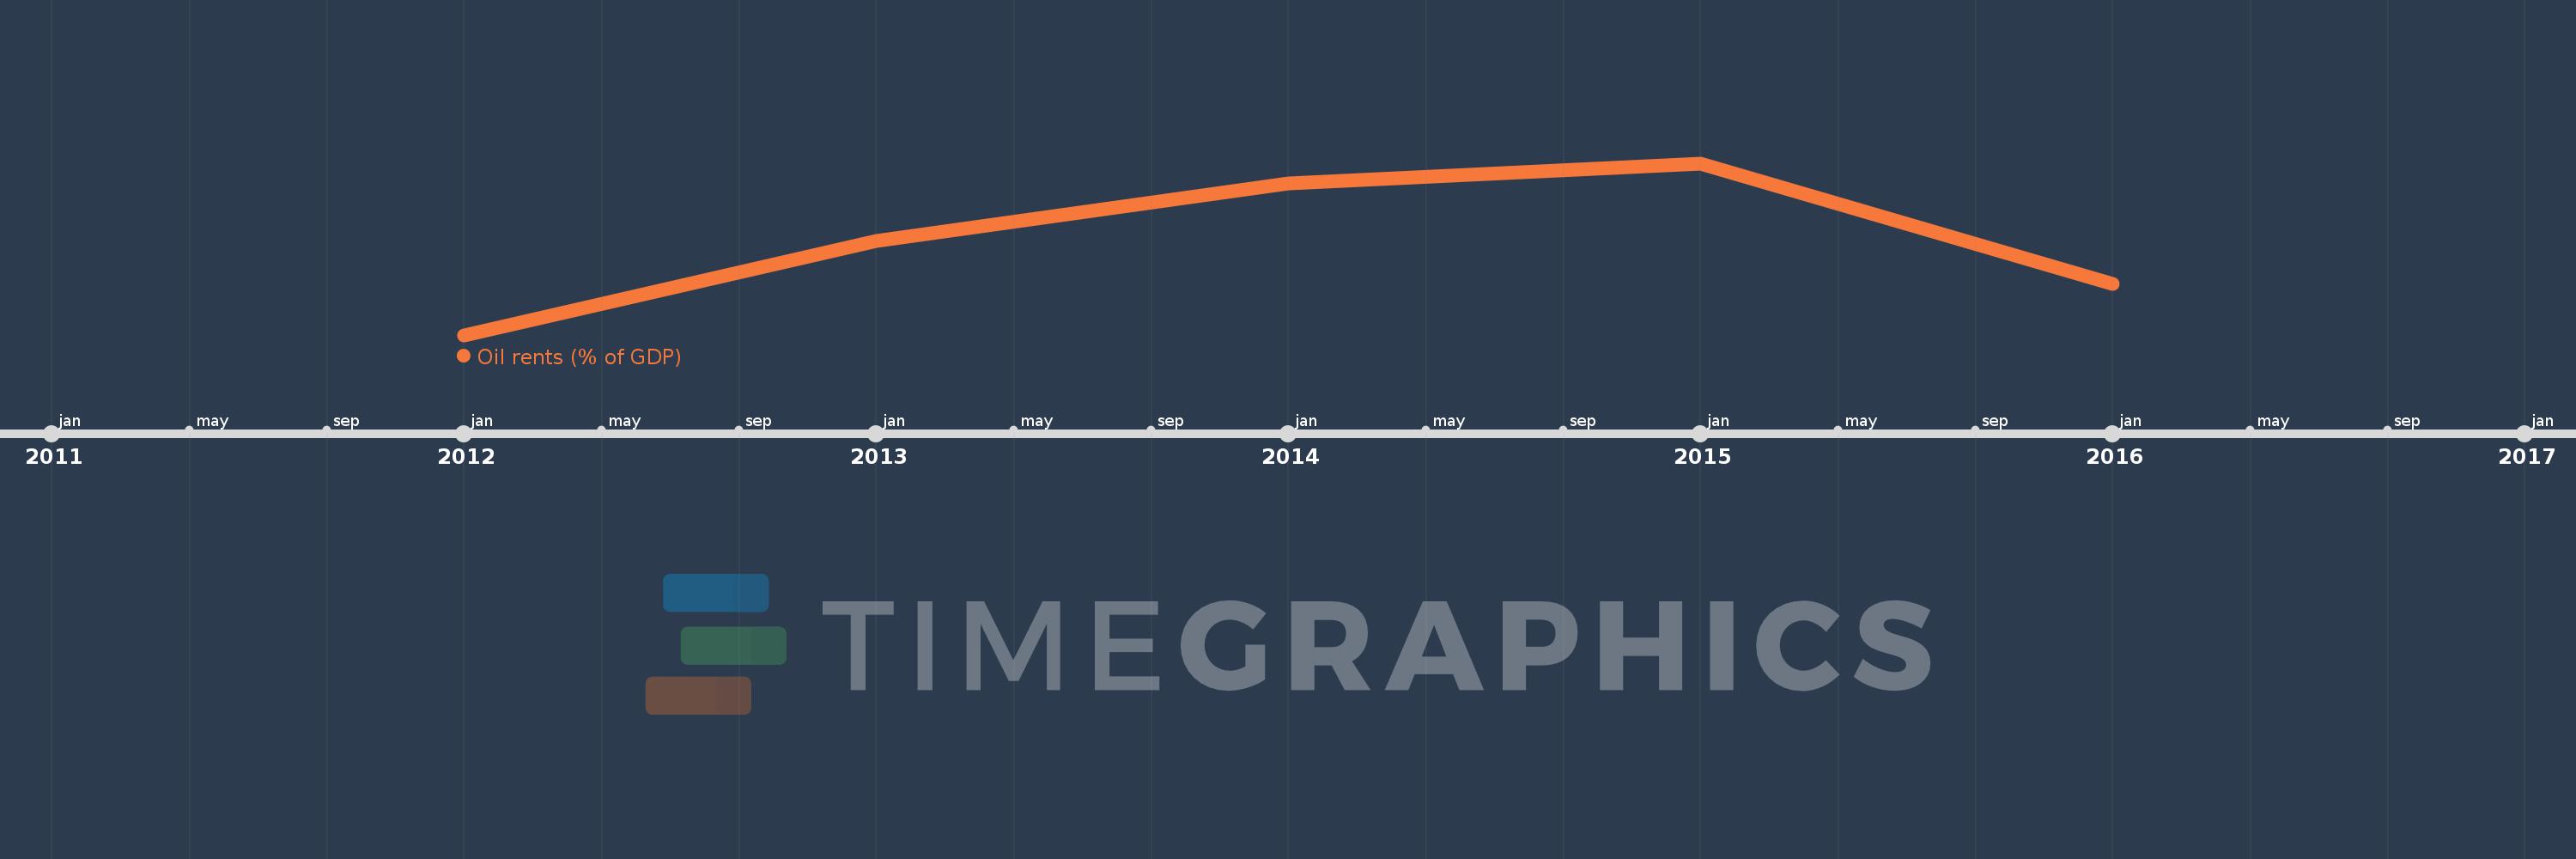
This timeline shows a graph from 2012 to 2016 of Niger. No data until 2011. Number of actual observations by date: 5.
Source name:
World Development Indicators
Source organization:
Estimates based on sources and methods described in "The Changing Wealth of Nations: Measuring Sustainable Development in the New Millennium" (World Bank, 2011).
Categories, topics:
Energy & Mining, Environment
Last updated:
apr 23, 2017
Indicators value changes by year
At the date of observation
Value
Absolute change
Change from previous value
jan 1, 2012
0.338
+0.338
0.0%
jan 1, 2013
2.771
+2.433
720.75%
jan 1, 2014
4.275
+1.504
54.28%
jan 1, 2015
4.793
+0.518
12.12%
jan 1, 2016
1.668
-3.125
-65.19%
Ranking of countries by current statistics by years


Comments: