29
/
en
AIzaSyAYiBZKx7MnpbEhh9jyipgxe19OcubqV5w
April 1, 2024
119242
Denmark
DNK
true
2
1
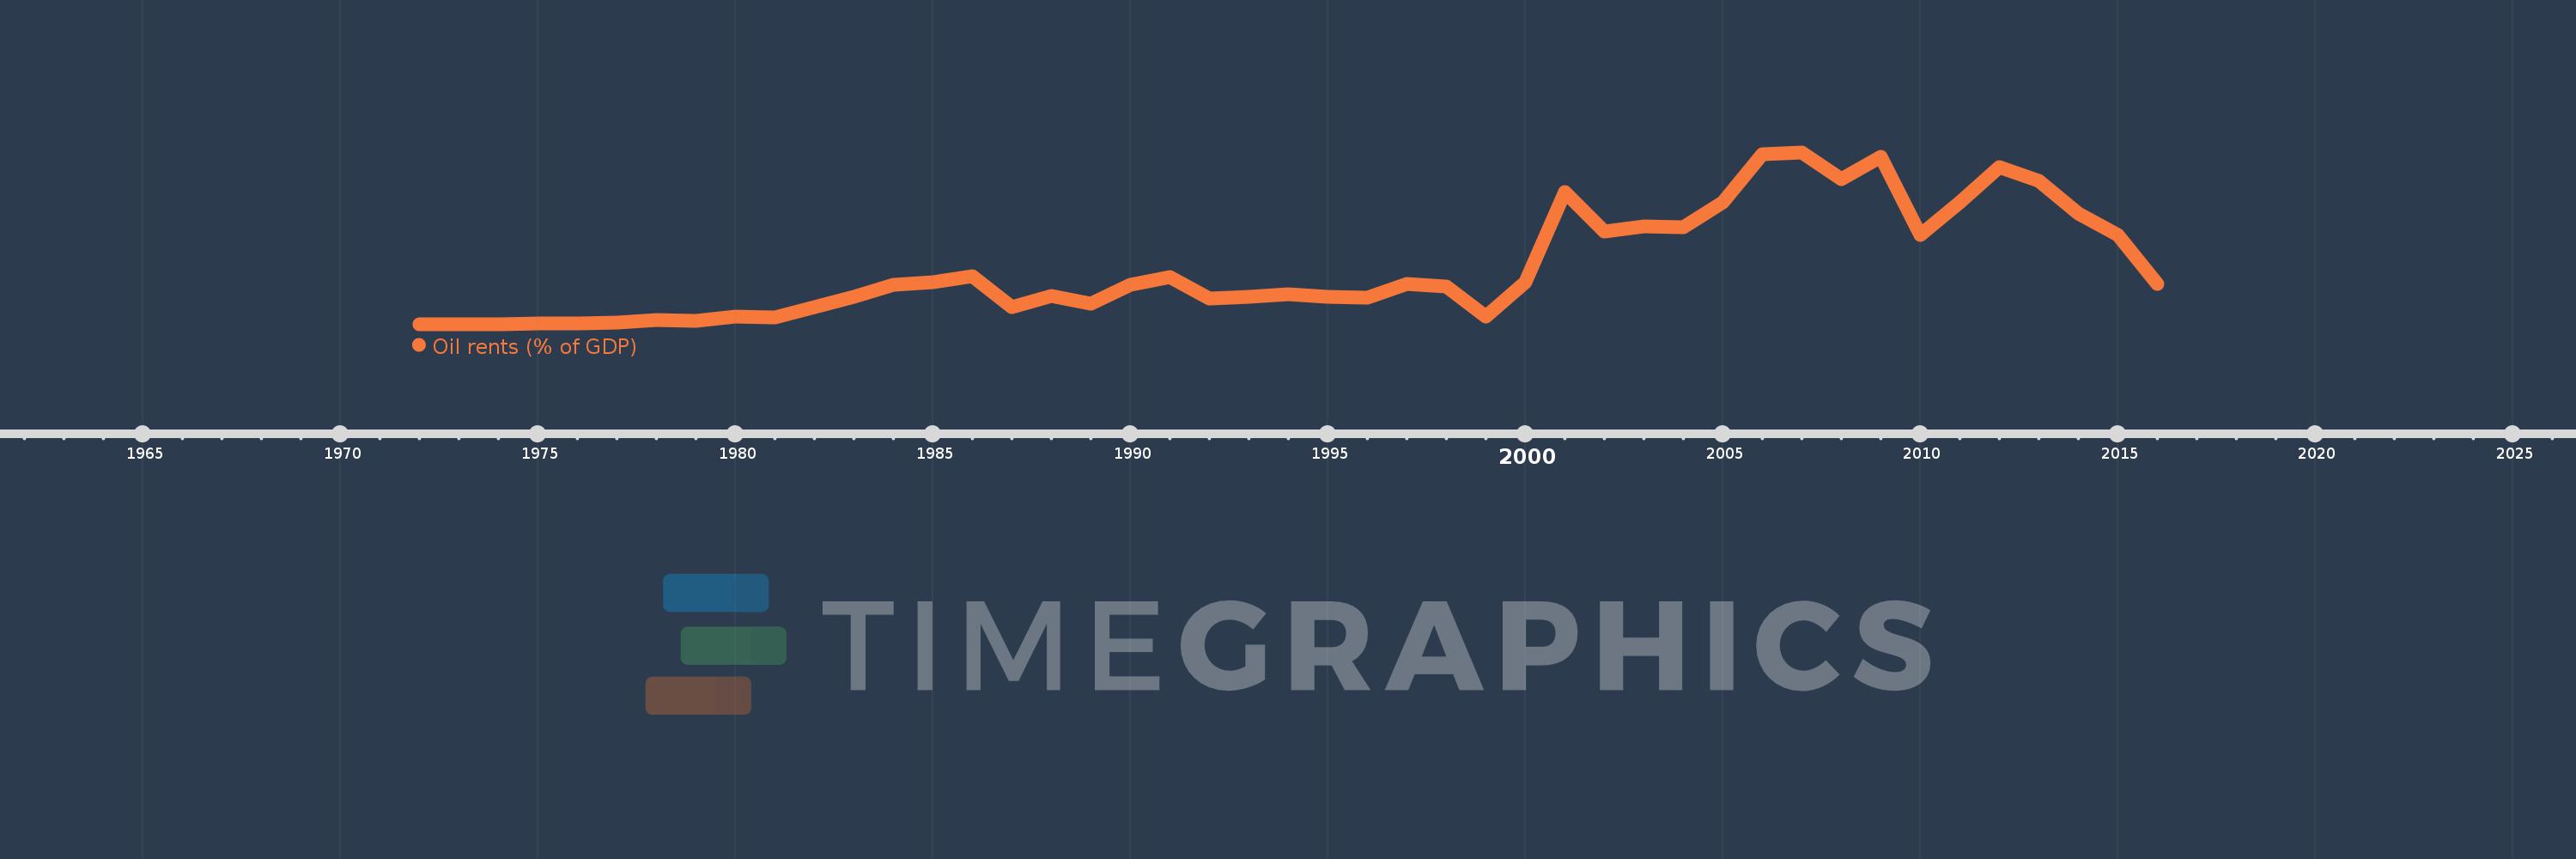
Oil rents (% of GDP)
2016,2015,2014,2013,2012,2011,2010,2009,2008,2007,2006,2005,2004,2003,2002,2001,2000,1999,1998,1997,1996,1995,1994,1993,1992,1991,1990,1989,1988,1987,1986,1985,1984,1983,1982,1981,1980,1979,1978,1977,1976,1975,1974,1973,1972
This statistics in other country:
Timeline:
This timeline shows a graph from 1972 to 2016 of Denmark. No data until 1971. Number of actual observations by date: 45.
Source name:
World Development Indicators
Source organization:
Estimates based on sources and methods described in "The Changing Wealth of Nations: Measuring Sustainable Development in the New Millennium" (World Bank, 2011).
Categories, topics:
Energy & Mining, Environment
Last updated:
apr 23, 2017
Indicators value changes by year
At the date of observation
Value
Absolute change
Change from previous value
jan 1, 1974
0.0
+0.0
9.15%
jan 1, 1975
0.008
+0.008
5.48K%
jan 1, 1976
0.011
+0.003
39.57%
jan 1, 1977
0.016
+0.005
48.33%
jan 1, 1978
0.043
+0.027
164.73%
jan 1, 1979
0.032
-0.012
-26.85%
jan 1, 1980
0.074
+0.043
135.31%
jan 1, 1981
0.065
-0.01
-13.17%
jan 1, 1982
0.162
+0.097
150.83%
jan 1, 1983
0.266
+0.104
64.21%
jan 1, 1984
0.378
+0.112
42.23%
jan 1, 1985
0.404
+0.026
6.85%
jan 1, 1986
0.46
+0.056
13.79%
jan 1, 1987
0.163
-0.296
-64.52%
jan 1, 1988
0.27
+0.107
65.56%
jan 1, 1989
0.198
-0.072
-26.73%
jan 1, 1990
0.379
+0.181
91.4%
jan 1, 1991
0.457
+0.078
20.72%
jan 1, 1992
0.248
-0.209
-45.76%
jan 1, 1993
0.26
+0.012
4.79%
jan 1, 1994
0.287
+0.027
10.55%
jan 1, 1995
0.267
-0.02
-6.93%
jan 1, 1996
0.254
-0.013
-5.04%
jan 1, 1997
0.383
+0.129
50.77%
jan 1, 1998
0.359
-0.024
-6.2%
jan 1, 1999
0.077
-0.282
-78.61%
jan 1, 2000
0.406
+0.329
429.0%
jan 1, 2001
1.267
+0.861
211.99%
jan 1, 2002
0.891
-0.376
-29.65%
jan 1, 2003
0.943
+0.052
5.84%
jan 1, 2004
0.929
-0.015
-1.54%
jan 1, 2005
1.173
+0.244
26.26%
jan 1, 2006
1.632
+0.46
39.19%
jan 1, 2007
1.65
+0.018
1.07%
jan 1, 2008
1.39
-0.26
-15.74%
jan 1, 2009
1.606
+0.216
15.52%
jan 1, 2010
0.856
-0.75
-46.71%
jan 1, 2011
1.174
+0.318
37.13%
jan 1, 2012
1.511
+0.337
28.73%
jan 1, 2013
1.38
-0.131
-8.67%
jan 1, 2014
1.064
-0.315
-22.86%
jan 1, 2015
0.859
-0.205
-19.29%
jan 1, 2016
0.39
-0.469
-54.62%
Ranking of countries by current statistics by years


Comments: