29
/
en
AIzaSyAYiBZKx7MnpbEhh9jyipgxe19OcubqV5w
April 1, 2024
209635
New Zealand
NZL
true
2
1
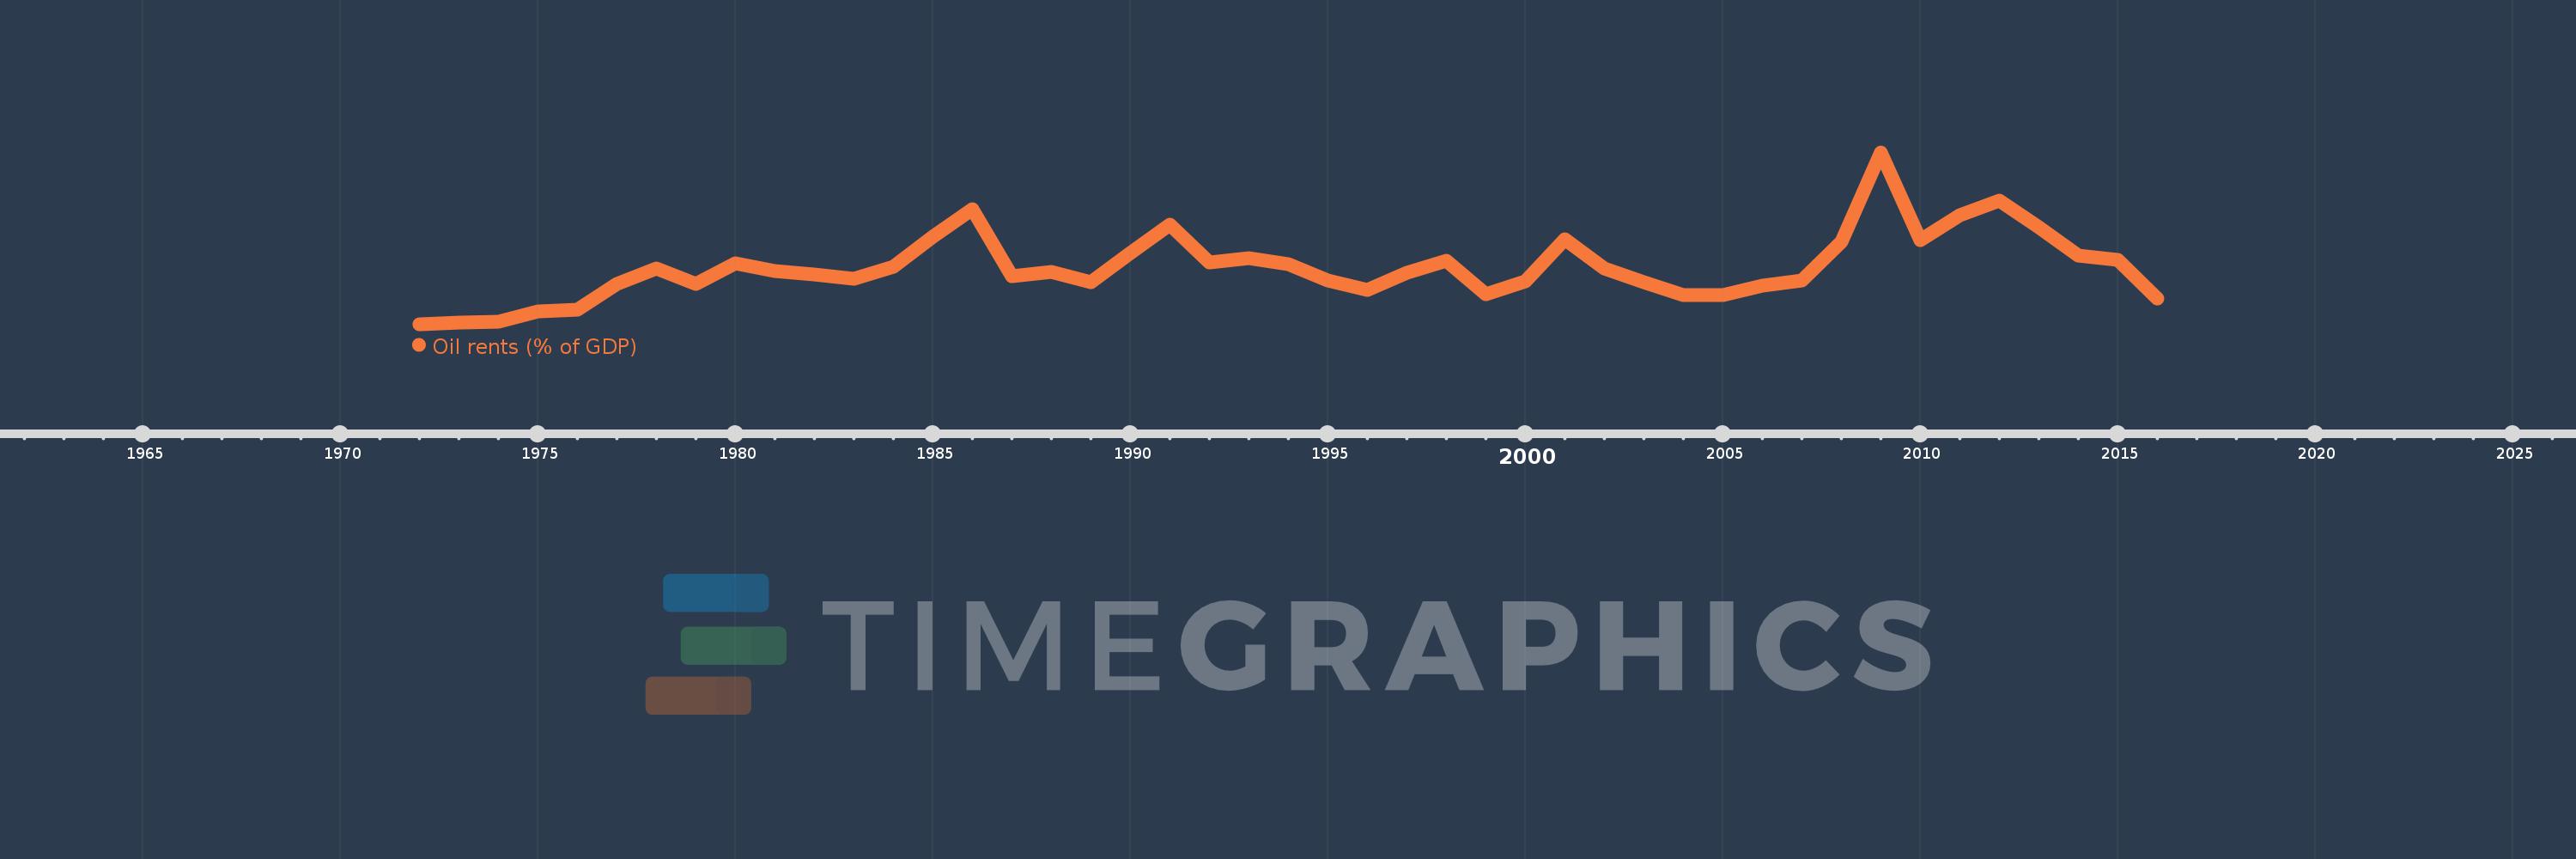
Oil rents (% of GDP)
2016,2015,2014,2013,2012,2011,2010,2009,2008,2007,2006,2005,2004,2003,2002,2001,2000,1999,1998,1997,1996,1995,1994,1993,1992,1991,1990,1989,1988,1987,1986,1985,1984,1983,1982,1981,1980,1979,1978,1977,1976,1975,1974,1973,1972
This statistics in other country:
Timeline:
This timeline shows a graph from 1972 to 2016 of New Zealand. No data until 1971. Number of actual observations by date: 45.
Source name:
World Development Indicators
Source organization:
Estimates based on sources and methods described in "The Changing Wealth of Nations: Measuring Sustainable Development in the New Millennium" (World Bank, 2011).
Categories, topics:
Energy & Mining, Environment
Last updated:
apr 23, 2017
Indicators value changes by year
At the date of observation
Value
Absolute change
Change from previous value
jan 1, 1973
0.007
+0.007
%
jan 1, 1974
0.013
+0.006
88.67%
jan 1, 1975
0.07
+0.057
454.05%
jan 1, 1976
0.081
+0.011
16.09%
jan 1, 1977
0.221
+0.14
173.04%
jan 1, 1978
0.304
+0.084
37.99%
jan 1, 1979
0.221
-0.083
-27.35%
jan 1, 1980
0.331
+0.11
49.7%
jan 1, 1981
0.289
-0.042
-12.58%
jan 1, 1982
0.27
-0.02
-6.77%
jan 1, 1983
0.248
-0.022
-8.24%
jan 1, 1984
0.314
+0.067
26.89%
jan 1, 1985
0.475
+0.161
51.17%
jan 1, 1986
0.625
+0.151
31.69%
jan 1, 1987
0.26
-0.365
-58.37%
jan 1, 1988
0.285
+0.024
9.38%
jan 1, 1989
0.23
-0.055
-19.4%
jan 1, 1990
0.387
+0.158
68.8%
jan 1, 1991
0.54
+0.153
39.46%
jan 1, 1992
0.336
-0.205
-37.86%
jan 1, 1993
0.359
+0.024
7.05%
jan 1, 1994
0.326
-0.034
-9.44%
jan 1, 1995
0.238
-0.087
-26.86%
jan 1, 1996
0.188
-0.05
-21.01%
jan 1, 1997
0.28
+0.092
48.69%
jan 1, 1998
0.345
+0.065
23.21%
jan 1, 1999
0.163
-0.181
-52.67%
jan 1, 2000
0.235
+0.072
43.86%
jan 1, 2001
0.464
+0.23
97.93%
jan 1, 2002
0.305
-0.16
-34.42%
jan 1, 2003
0.23
-0.074
-24.45%
jan 1, 2004
0.157
-0.073
-31.7%
jan 1, 2005
0.159
+0.002
1.21%
jan 1, 2006
0.209
+0.05
31.4%
jan 1, 2007
0.238
+0.029
13.9%
jan 1, 2008
0.447
+0.209
87.79%
jan 1, 2009
0.935
+0.488
109.18%
jan 1, 2010
0.46
-0.475
-50.81%
jan 1, 2011
0.595
+0.135
29.31%
jan 1, 2012
0.674
+0.079
13.34%
jan 1, 2013
0.527
-0.147
-21.81%
jan 1, 2014
0.375
-0.152
-28.81%
jan 1, 2015
0.349
-0.027
-7.12%
jan 1, 2016
0.14
-0.208
-59.77%
Ranking of countries by current statistics by years


Comments: