29
/
en
AIzaSyAYiBZKx7MnpbEhh9jyipgxe19OcubqV5w
April 1, 2024
270831
Turkmenistan
TKM
true
2
1
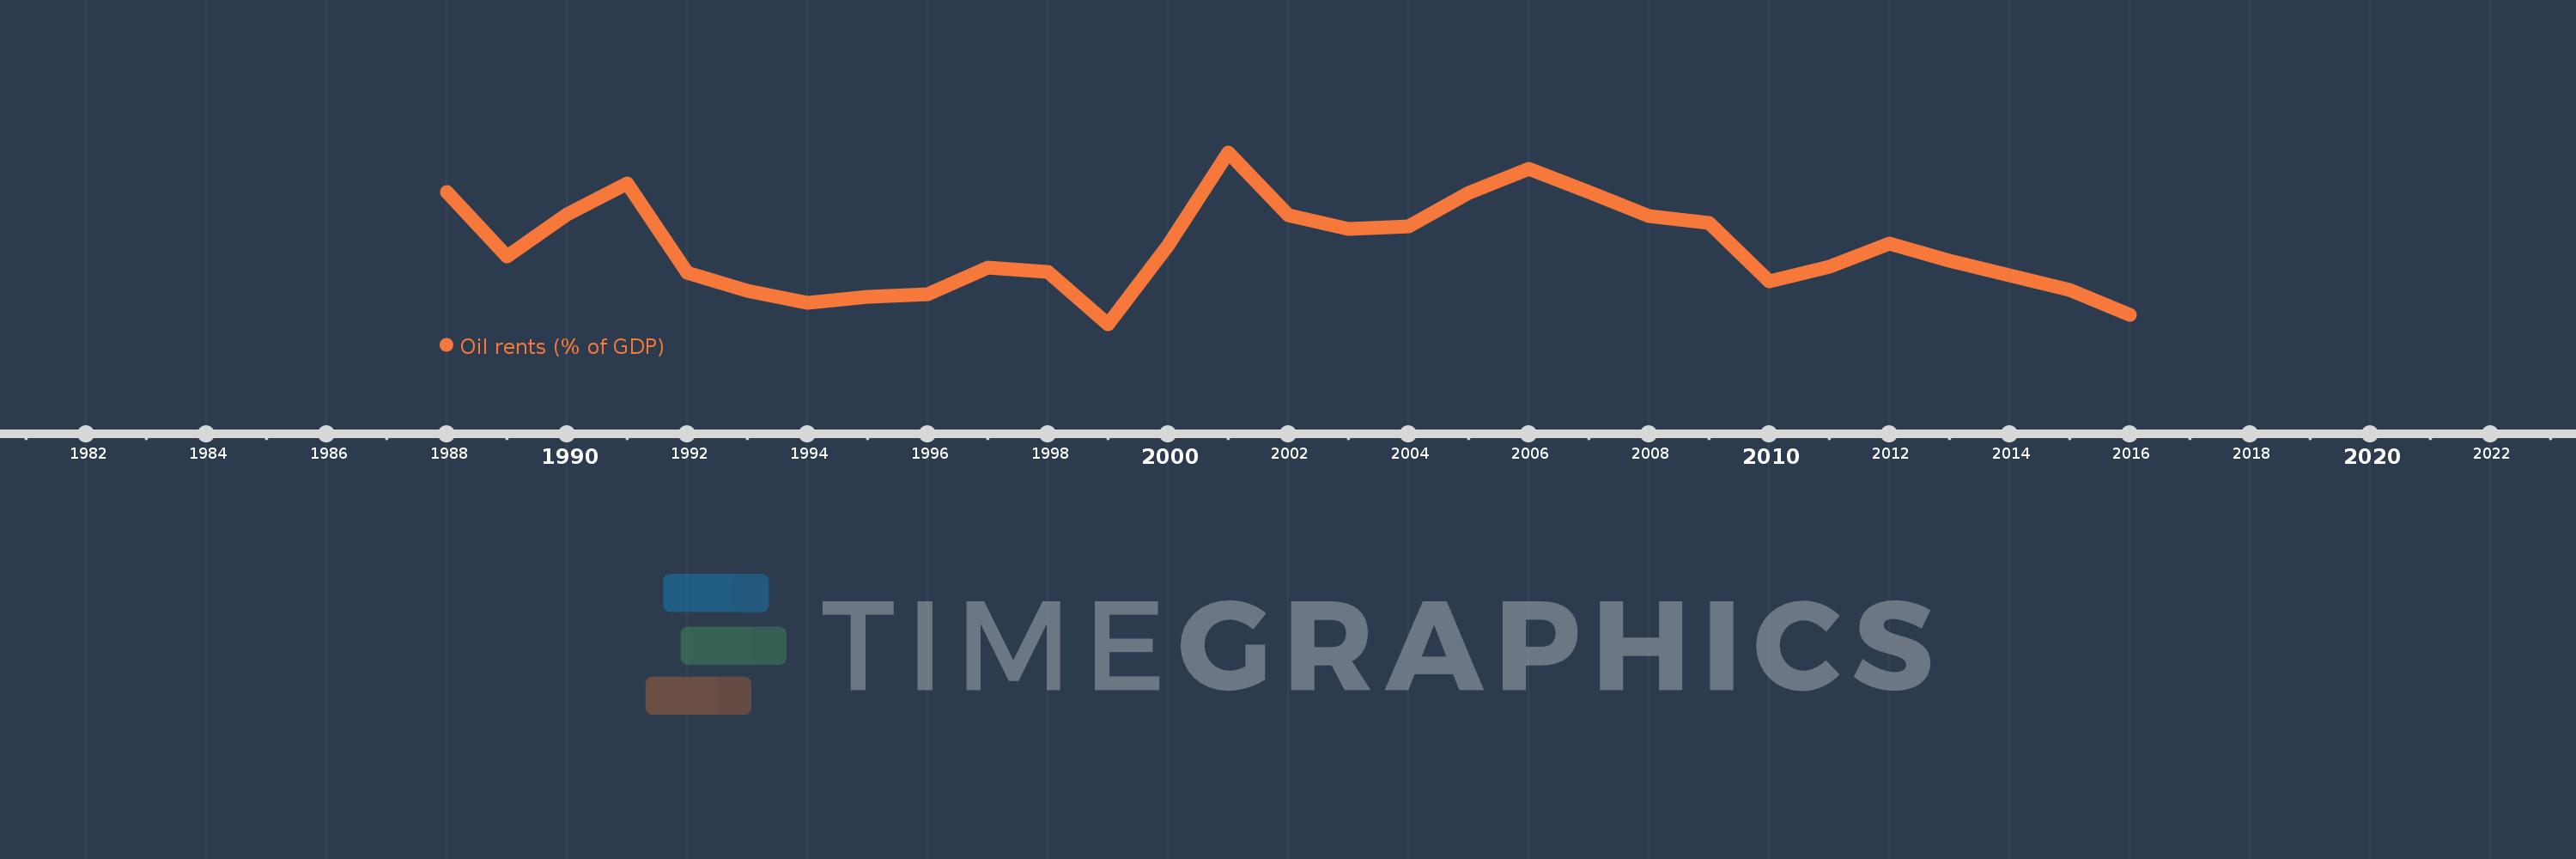
Oil rents (% of GDP)
2016,2015,2014,2013,2012,2011,2010,2009,2008,2007,2006,2005,2004,2003,2002,2001,2000,1999,1998,1997,1996,1995,1994,1993,1992,1991,1990,1989,1988
This statistics in other country:
Timeline:
This timeline shows a graph from 1988 to 2016 of Turkmenistan. No data until 1987. Number of actual observations by date: 29.
Source name:
World Development Indicators
Source organization:
Estimates based on sources and methods described in "The Changing Wealth of Nations: Measuring Sustainable Development in the New Millennium" (World Bank, 2011).
Categories, topics:
Energy & Mining, Environment
Last updated:
apr 23, 2017
Indicators value changes by year
Maximum:
26.667
jan 1, 2001
At the date of observation
Value
Absolute change
Change from previous value
jan 1, 1988
21.128
+21.128
0.0%
jan 1, 1989
11.932
-9.195
-43.52%
jan 1, 1990
17.868
+5.935
49.74%
jan 1, 1991
22.235
+4.367
24.44%
jan 1, 1992
9.728
-12.507
-56.25%
jan 1, 1993
7.088
-2.64
-27.14%
jan 1, 1994
5.396
-1.692
-23.87%
jan 1, 1995
6.352
+0.956
17.72%
jan 1, 1996
6.703
+0.351
5.52%
jan 1, 1997
10.386
+3.683
54.94%
jan 1, 1998
9.8
-0.586
-5.65%
jan 1, 1999
2.427
-7.373
-75.23%
jan 1, 2000
13.615
+11.188
460.99%
jan 1, 2001
26.667
+13.052
95.87%
jan 1, 2002
17.751
-8.916
-33.43%
jan 1, 2003
15.87
-1.881
-10.6%
jan 1, 2004
16.247
+0.377
2.38%
jan 1, 2005
20.953
+4.705
28.96%
jan 1, 2006
24.321
+3.369
16.08%
jan 1, 2007
21.02
-3.301
-13.57%
jan 1, 2008
17.726
-3.295
-15.67%
jan 1, 2009
16.729
-0.997
-5.62%
jan 1, 2010
8.42
-8.309
-49.67%
jan 1, 2011
10.537
+2.118
25.15%
jan 1, 2012
13.789
+3.252
30.86%
jan 1, 2013
11.344
-2.445
-17.73%
jan 1, 2014
9.359
-1.986
-17.5%
jan 1, 2015
7.226
-2.133
-22.79%
jan 1, 2016
3.731
-3.494
-48.36%
Ranking of countries by current statistics by years


Comments: