29
/
en
AIzaSyAYiBZKx7MnpbEhh9jyipgxe19OcubqV5w
April 1, 2024
144826
Guatemala
GTM
true
2
1
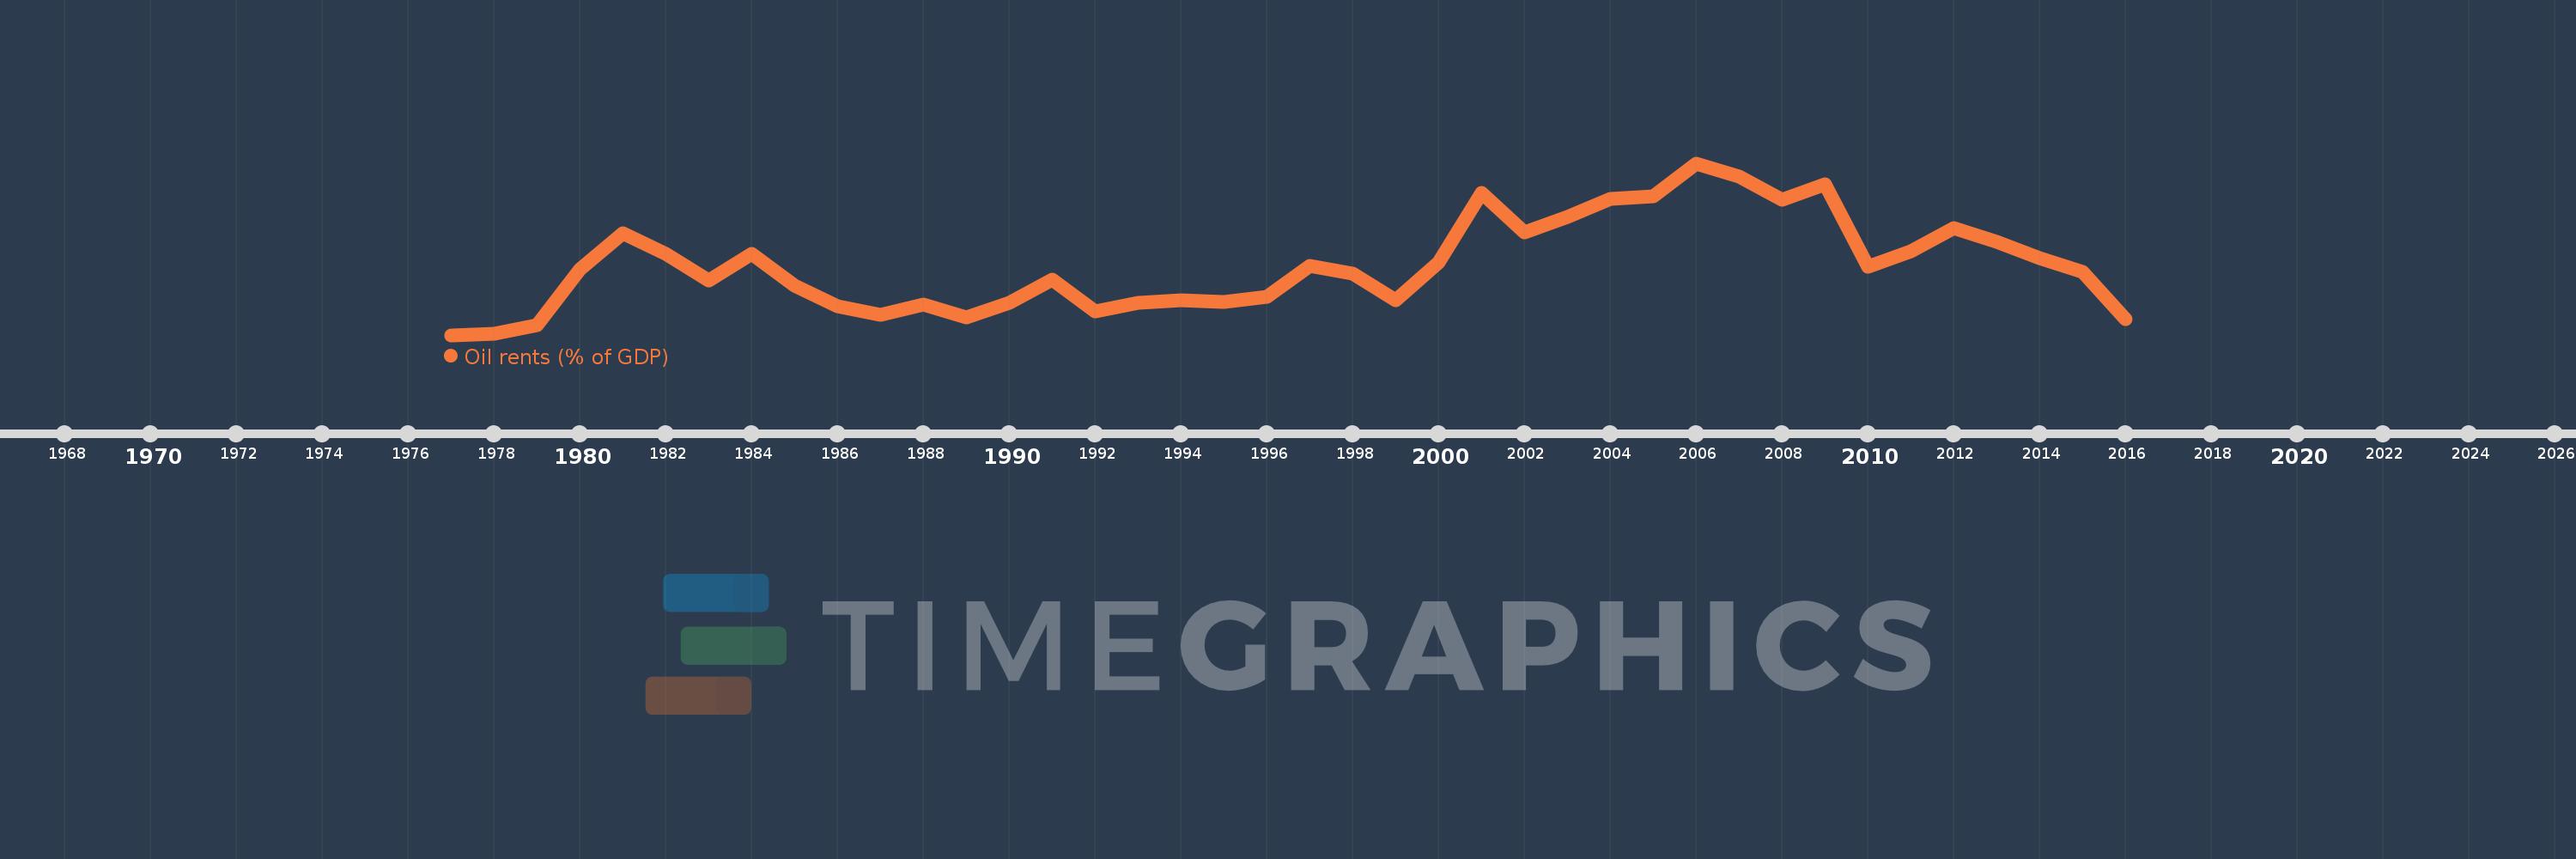
Oil rents (% of GDP)
2016,2015,2014,2013,2012,2011,2010,2009,2008,2007,2006,2005,2004,2003,2002,2001,2000,1999,1998,1997,1996,1995,1994,1993,1992,1991,1990,1989,1988,1987,1986,1985,1984,1983,1982,1981,1980,1979,1978,1977
This statistics in other country:
Timeline:
This timeline shows a graph from 1977 to 2016 of Guatemala. No data until 1976. Number of actual observations by date: 40.
Source name:
World Development Indicators
Source organization:
Estimates based on sources and methods described in "The Changing Wealth of Nations: Measuring Sustainable Development in the New Millennium" (World Bank, 2011).
Categories, topics:
Energy & Mining, Environment
Last updated:
apr 23, 2017
Indicators value changes by year
At the date of observation
Value
Absolute change
Change from previous value
jan 1, 1977
0.015
+0.015
0.0%
jan 1, 1978
0.021
+0.006
40.25%
jan 1, 1979
0.065
+0.045
219.28%
jan 1, 1980
0.336
+0.271
413.42%
jan 1, 1981
0.514
+0.178
53.0%
jan 1, 1982
0.412
-0.103
-19.96%
jan 1, 1983
0.283
-0.129
-31.33%
jan 1, 1984
0.414
+0.131
46.38%
jan 1, 1985
0.258
-0.155
-37.56%
jan 1, 1986
0.156
-0.103
-39.69%
jan 1, 1987
0.116
-0.04
-25.55%
jan 1, 1988
0.163
+0.047
40.49%
jan 1, 1989
0.103
-0.06
-36.99%
jan 1, 1990
0.174
+0.071
69.44%
jan 1, 1991
0.289
+0.115
65.97%
jan 1, 1992
0.129
-0.16
-55.49%
jan 1, 1993
0.174
+0.045
35.02%
jan 1, 1994
0.187
+0.013
7.76%
jan 1, 1995
0.179
-0.008
-4.37%
jan 1, 1996
0.202
+0.024
13.17%
jan 1, 1997
0.356
+0.153
75.76%
jan 1, 1998
0.318
-0.038
-10.59%
jan 1, 1999
0.188
-0.13
-40.85%
jan 1, 2000
0.373
+0.185
98.22%
jan 1, 2001
0.713
+0.34
91.22%
jan 1, 2002
0.521
-0.192
-26.94%
jan 1, 2003
0.596
+0.075
14.41%
jan 1, 2004
0.685
+0.089
14.96%
jan 1, 2005
0.698
+0.013
1.83%
jan 1, 2006
0.859
+0.161
23.12%
jan 1, 2007
0.795
-0.064
-7.44%
jan 1, 2008
0.679
-0.116
-14.55%
jan 1, 2009
0.757
+0.078
11.43%
jan 1, 2010
0.352
-0.405
-53.49%
jan 1, 2011
0.428
+0.075
21.43%
jan 1, 2012
0.54
+0.112
26.25%
jan 1, 2013
0.474
-0.066
-12.15%
jan 1, 2014
0.393
-0.081
-17.1%
jan 1, 2015
0.324
-0.07
-17.7%
jan 1, 2016
0.094
-0.229
-70.82%
Ranking of countries by current statistics by years


Comments: