29
/
en
AIzaSyAYiBZKx7MnpbEhh9jyipgxe19OcubqV5w
April 1, 2024
36050
High income
HIC
false
2
1
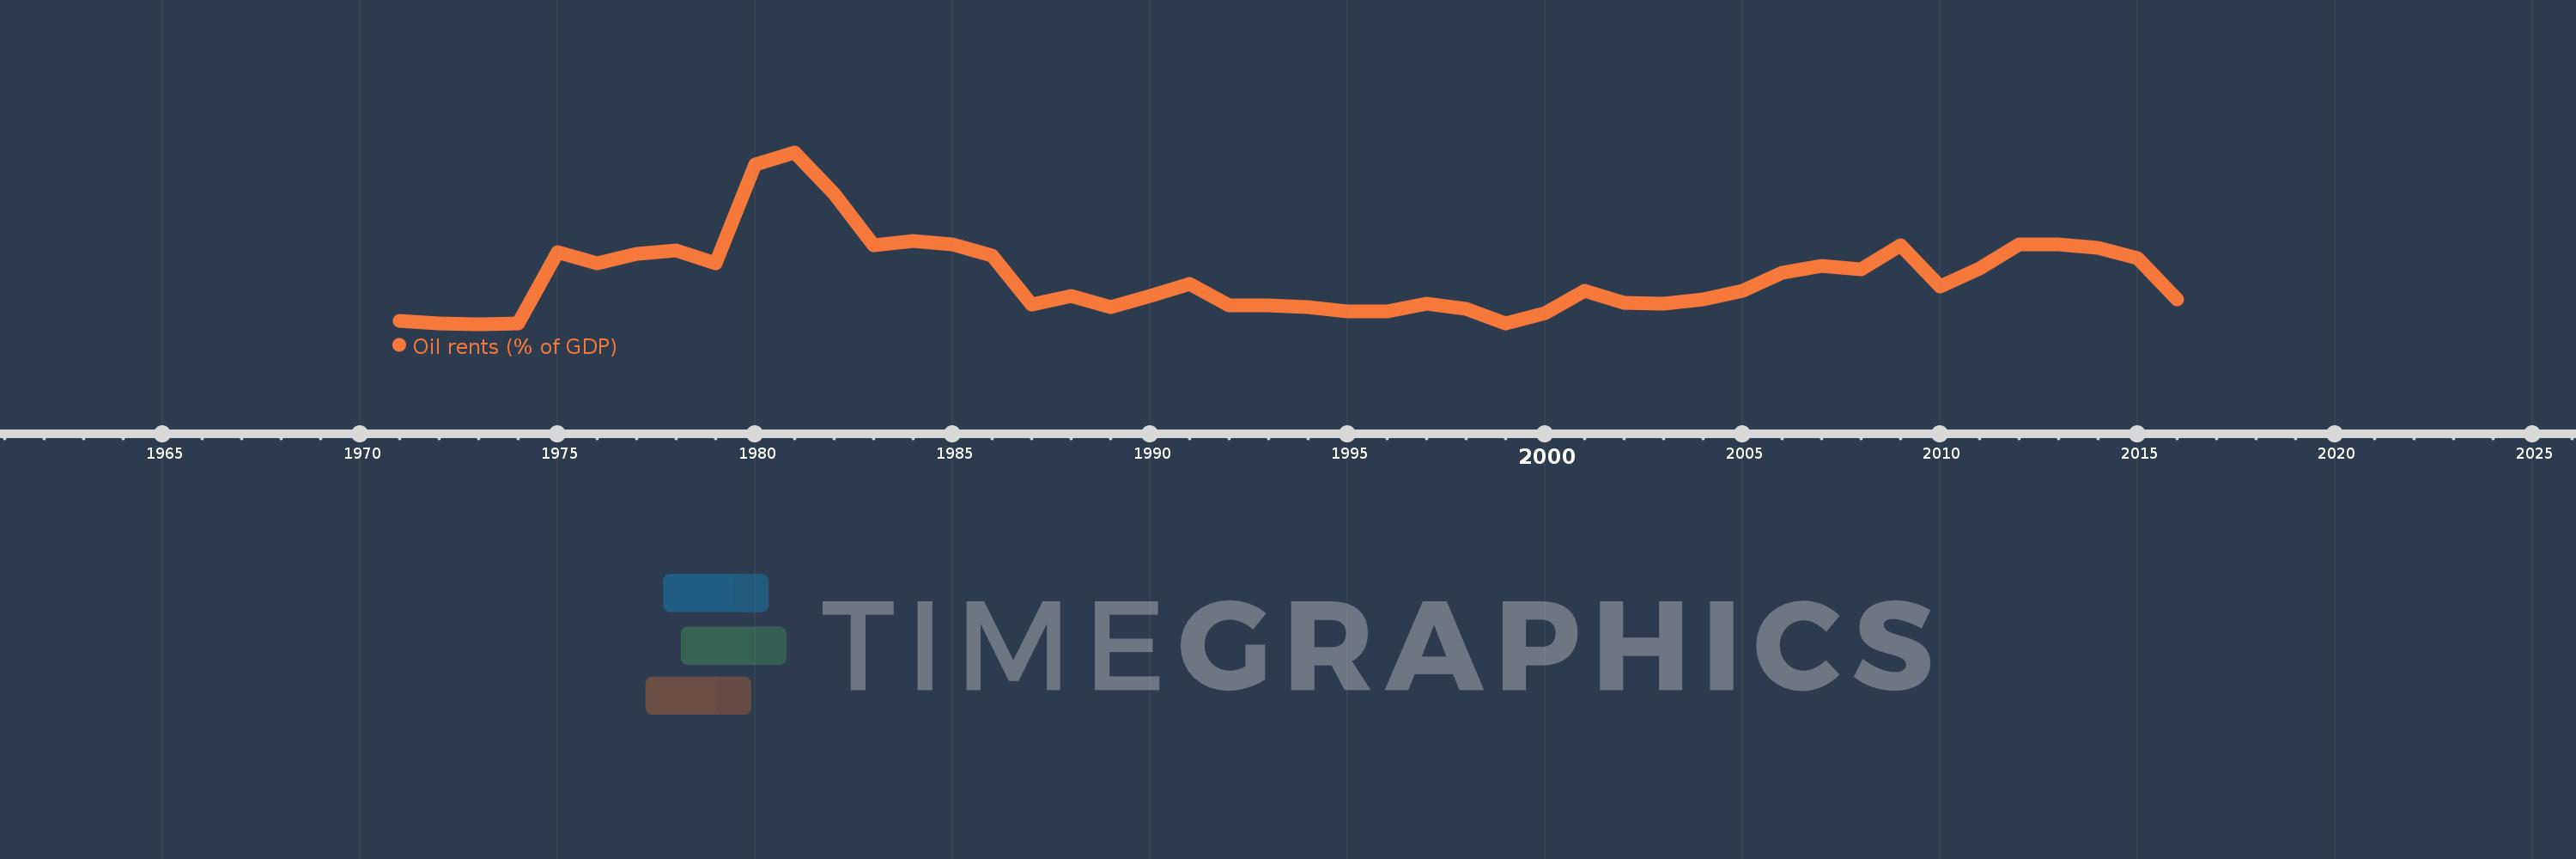
Oil rents (% of GDP)
2016,2015,2014,2013,2012,2011,2010,2009,2008,2007,2006,2005,2004,2003,2002,2001,2000,1999,1998,1997,1996,1995,1994,1993,1992,1991,1990,1989,1988,1987,1986,1985,1984,1983,1982,1981,1980,1979,1978,1977,1976,1975,1974,1973,1972,1971
This statistics in other country:
Timeline:
This timeline shows a graph from 1971 to 2016 of High income. No data until 1970. Number of actual observations by date: 46.
Source name:
World Development Indicators
Source organization:
Estimates based on sources and methods described in "The Changing Wealth of Nations: Measuring Sustainable Development in the New Millennium" (World Bank, 2011).
Categories, topics:
Energy & Mining, Environment
Last updated:
apr 23, 2017
Indicators value changes by year
At the date of observation
Value
Absolute change
Change from previous value
jan 1, 1971
0.262
+0.262
0.0%
jan 1, 1972
0.209
-0.052
-20.02%
jan 1, 1973
0.201
-0.008
-3.91%
jan 1, 1974
0.213
+0.012
6.05%
jan 1, 1975
1.437
+1.223
573.2%
jan 1, 1976
1.243
-0.194
-13.51%
jan 1, 1977
1.412
+0.169
13.62%
jan 1, 1978
1.465
+0.053
3.73%
jan 1, 1979
1.251
-0.213
-14.57%
jan 1, 1980
2.943
+1.692
135.21%
jan 1, 1981
3.144
+0.201
6.84%
jan 1, 1982
2.441
-0.703
-22.36%
jan 1, 1983
1.554
-0.888
-36.36%
jan 1, 1984
1.622
+0.068
4.39%
jan 1, 1985
1.563
-0.058
-3.61%
jan 1, 1986
1.373
-0.19
-12.17%
jan 1, 1987
0.544
-0.829
-60.37%
jan 1, 1988
0.682
+0.138
25.28%
jan 1, 1989
0.487
-0.195
-28.59%
jan 1, 1990
0.692
+0.205
42.1%
jan 1, 1991
0.884
+0.192
27.81%
jan 1, 1992
0.521
-0.363
-41.09%
jan 1, 1993
0.527
+0.007
1.28%
jan 1, 1994
0.488
-0.039
-7.4%
jan 1, 1995
0.413
-0.075
-15.39%
jan 1, 1996
0.42
+0.007
1.65%
jan 1, 1997
0.556
+0.136
32.28%
jan 1, 1998
0.466
-0.09
-16.15%
jan 1, 1999
0.221
-0.245
-52.65%
jan 1, 2000
0.389
+0.169
76.43%
jan 1, 2001
0.774
+0.385
98.98%
jan 1, 2002
0.567
-0.208
-26.84%
jan 1, 2003
0.549
-0.018
-3.16%
jan 1, 2004
0.625
+0.076
13.87%
jan 1, 2005
0.778
+0.153
24.47%
jan 1, 2006
1.087
+0.309
39.75%
jan 1, 2007
1.197
+0.11
10.15%
jan 1, 2008
1.134
-0.063
-5.27%
jan 1, 2009
1.55
+0.416
36.72%
jan 1, 2010
0.841
-0.71
-45.77%
jan 1, 2011
1.151
+0.31
36.92%
jan 1, 2012
1.573
+0.422
36.64%
jan 1, 2013
1.564
-0.009
-0.6%
jan 1, 2014
1.503
-0.06
-3.85%
jan 1, 2015
1.336
-0.167
-11.1%
jan 1, 2016
0.632
-0.704
-52.69%
Ranking of countries by current statistics by years


Comments: