29
/
en
AIzaSyAYiBZKx7MnpbEhh9jyipgxe19OcubqV5w
April 1, 2024
196001
Mexico
MEX
true
2
1
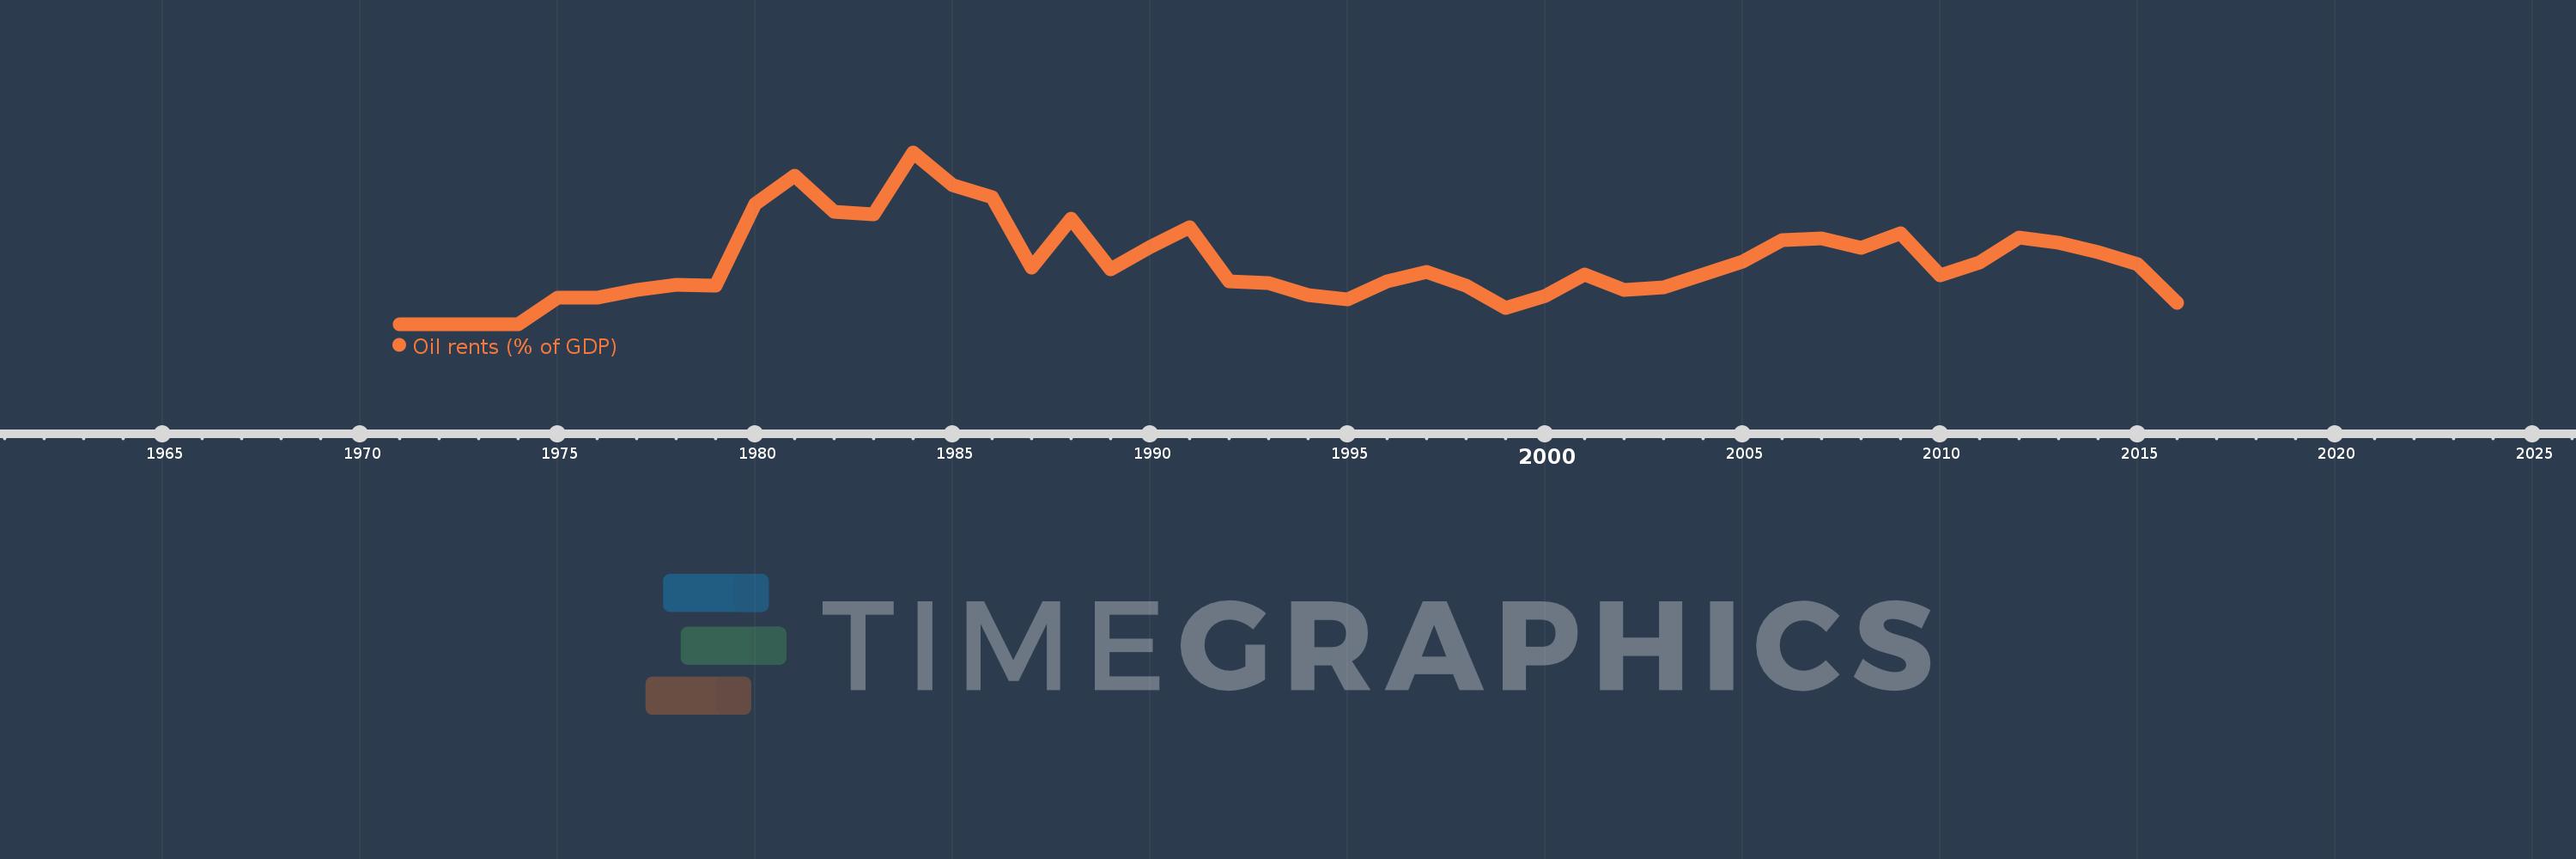
Oil rents (% of GDP)
2016,2015,2014,2013,2012,2011,2010,2009,2008,2007,2006,2005,2004,2003,2002,2001,2000,1999,1998,1997,1996,1995,1994,1993,1992,1991,1990,1989,1988,1987,1986,1985,1984,1983,1982,1981,1980,1979,1978,1977,1976,1975,1974,1973,1972,1971
This statistics in other country:
Timeline:
This timeline shows a graph from 1971 to 2016 of Mexico. No data until 1970. Number of actual observations by date: 46.
Source name:
World Development Indicators
Source organization:
Estimates based on sources and methods described in "The Changing Wealth of Nations: Measuring Sustainable Development in the New Millennium" (World Bank, 2011).
Categories, topics:
Energy & Mining, Environment
Last updated:
apr 23, 2017
Indicators value changes by year
Maximum:
10.597
jan 1, 1984
At the date of observation
Value
Absolute change
Change from previous value
jan 1, 1972
0.001
+0.0
284.69%
jan 1, 1973
0.001
0.0
-1.09%
jan 1, 1974
0.005
+0.004
689.3%
jan 1, 1975
1.643
+1.638
35.47K%
jan 1, 1976
1.619
-0.024
-1.45%
jan 1, 1977
2.095
+0.475
29.36%
jan 1, 1978
2.452
+0.358
17.07%
jan 1, 1979
2.383
-0.069
-2.81%
jan 1, 1980
7.426
+5.043
211.6%
jan 1, 1981
9.147
+1.722
23.19%
jan 1, 1982
6.951
-2.197
-24.01%
jan 1, 1983
6.752
-0.199
-2.86%
jan 1, 1984
10.597
+3.846
56.96%
jan 1, 1985
8.602
-1.995
-18.83%
jan 1, 1986
7.814
-0.788
-9.16%
jan 1, 1987
3.498
-4.316
-55.24%
jan 1, 1988
6.517
+3.02
86.34%
jan 1, 1989
3.36
-3.157
-48.44%
jan 1, 1990
4.778
+1.417
42.18%
jan 1, 1991
5.97
+1.192
24.95%
jan 1, 1992
2.656
-3.314
-55.5%
jan 1, 1993
2.555
-0.101
-3.8%
jan 1, 1994
1.784
-0.771
-30.17%
jan 1, 1995
1.555
-0.229
-12.85%
jan 1, 1996
2.644
+1.089
70.0%
jan 1, 1997
3.238
+0.594
22.46%
jan 1, 1998
2.398
-0.839
-25.93%
jan 1, 1999
0.99
-1.409
-58.74%
jan 1, 2000
1.75
+0.76
76.81%
jan 1, 2001
3.058
+1.309
74.79%
jan 1, 2002
2.096
-0.962
-31.46%
jan 1, 2003
2.275
+0.179
8.53%
jan 1, 2004
3.044
+0.769
33.82%
jan 1, 2005
3.853
+0.809
26.58%
jan 1, 2006
5.175
+1.321
34.29%
jan 1, 2007
5.313
+0.138
2.67%
jan 1, 2008
4.715
-0.598
-11.26%
jan 1, 2009
5.597
+0.882
18.72%
jan 1, 2010
2.996
-2.601
-46.47%
jan 1, 2011
3.796
+0.8
26.68%
jan 1, 2012
5.35
+1.555
40.95%
jan 1, 2013
5.052
-0.298
-5.57%
jan 1, 2014
4.426
-0.626
-12.4%
jan 1, 2015
3.689
-0.737
-16.65%
jan 1, 2016
1.309
-2.38
-64.52%
Ranking of countries by current statistics by years


Comments: