29
/
en
AIzaSyAYiBZKx7MnpbEhh9jyipgxe19OcubqV5w
April 1, 2024
107702
Colombia
COL
true
2
1
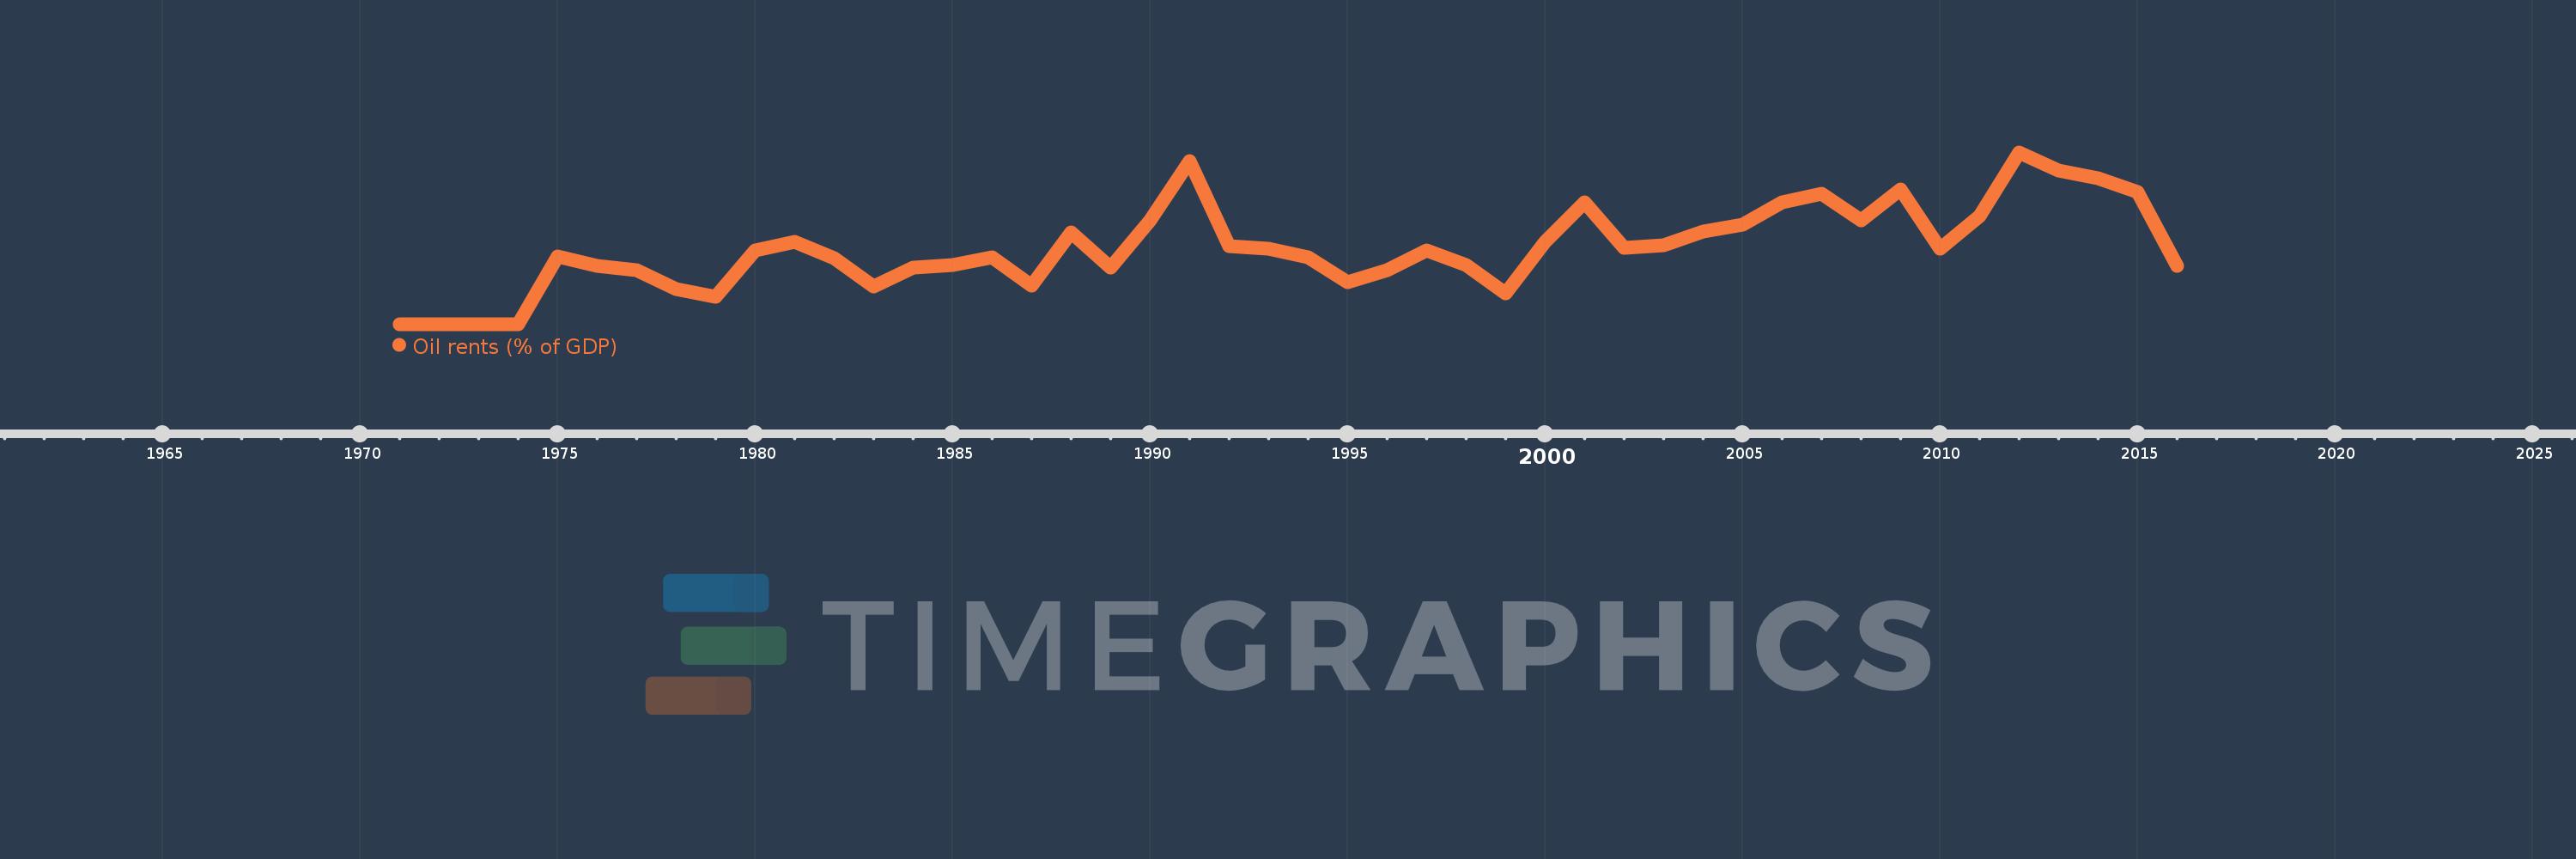
Oil rents (% of GDP)
2016,2015,2014,2013,2012,2011,2010,2009,2008,2007,2006,2005,2004,2003,2002,2001,2000,1999,1998,1997,1996,1995,1994,1993,1992,1991,1990,1989,1988,1987,1986,1985,1984,1983,1982,1981,1980,1979,1978,1977,1976,1975,1974,1973,1972,1971
This statistics in other country:
Timeline:
This timeline shows a graph from 1971 to 2016 of Colombia. No data until 1970. Number of actual observations by date: 46.
Source name:
World Development Indicators
Source organization:
Estimates based on sources and methods described in "The Changing Wealth of Nations: Measuring Sustainable Development in the New Millennium" (World Bank, 2011).
Categories, topics:
Energy & Mining, Environment
Last updated:
apr 23, 2017
Indicators value changes by year
At the date of observation
Value
Absolute change
Change from previous value
jan 1, 1972
0.001
+0.001
284.91%
jan 1, 1973
0.001
0.0
-9.9%
jan 1, 1974
0.009
+0.008
644.45%
jan 1, 1975
2.543
+2.534
27.84K%
jan 1, 1976
2.171
-0.372
-14.63%
jan 1, 1977
2.006
-0.165
-7.58%
jan 1, 1978
1.312
-0.694
-34.58%
jan 1, 1979
1.031
-0.282
-21.46%
jan 1, 1980
2.769
+1.738
168.64%
jan 1, 1981
3.066
+0.297
10.73%
jan 1, 1982
2.481
-0.585
-19.09%
jan 1, 1983
1.416
-1.065
-42.92%
jan 1, 1984
2.102
+0.686
48.45%
jan 1, 1985
2.218
+0.116
5.54%
jan 1, 1986
2.504
+0.286
12.89%
jan 1, 1987
1.451
-1.053
-42.06%
jan 1, 1988
3.439
+1.988
137.01%
jan 1, 1989
2.1
-1.339
-38.93%
jan 1, 1990
3.874
+1.774
84.48%
jan 1, 1991
6.102
+2.228
57.49%
jan 1, 1992
2.926
-3.176
-52.06%
jan 1, 1993
2.825
-0.101
-3.44%
jan 1, 1994
2.486
-0.339
-12.01%
jan 1, 1995
1.559
-0.927
-37.28%
jan 1, 1996
2.013
+0.454
29.15%
jan 1, 1997
2.769
+0.756
37.54%
jan 1, 1998
2.212
-0.557
-20.11%
jan 1, 1999
1.156
-1.057
-47.76%
jan 1, 2000
3.085
+1.929
166.93%
jan 1, 2001
4.544
+1.46
47.33%
jan 1, 2002
2.844
-1.701
-37.42%
jan 1, 2003
2.963
+0.119
4.18%
jan 1, 2004
3.471
+0.508
17.15%
jan 1, 2005
3.73
+0.259
7.45%
jan 1, 2006
4.552
+0.822
22.04%
jan 1, 2007
4.857
+0.305
6.7%
jan 1, 2008
3.874
-0.983
-20.23%
jan 1, 2009
5.047
+1.173
30.27%
jan 1, 2010
2.819
-2.228
-44.15%
jan 1, 2011
4.049
+1.23
43.64%
jan 1, 2012
6.414
+2.365
58.4%
jan 1, 2013
5.752
-0.661
-10.31%
jan 1, 2014
5.434
-0.318
-5.53%
jan 1, 2015
4.948
-0.486
-8.95%
jan 1, 2016
2.181
-2.766
-55.91%
Ranking of countries by current statistics by years


Comments: