29
/
en
AIzaSyAYiBZKx7MnpbEhh9jyipgxe19OcubqV5w
April 1, 2024
260014
Tajikistan
TJK
true
2
1
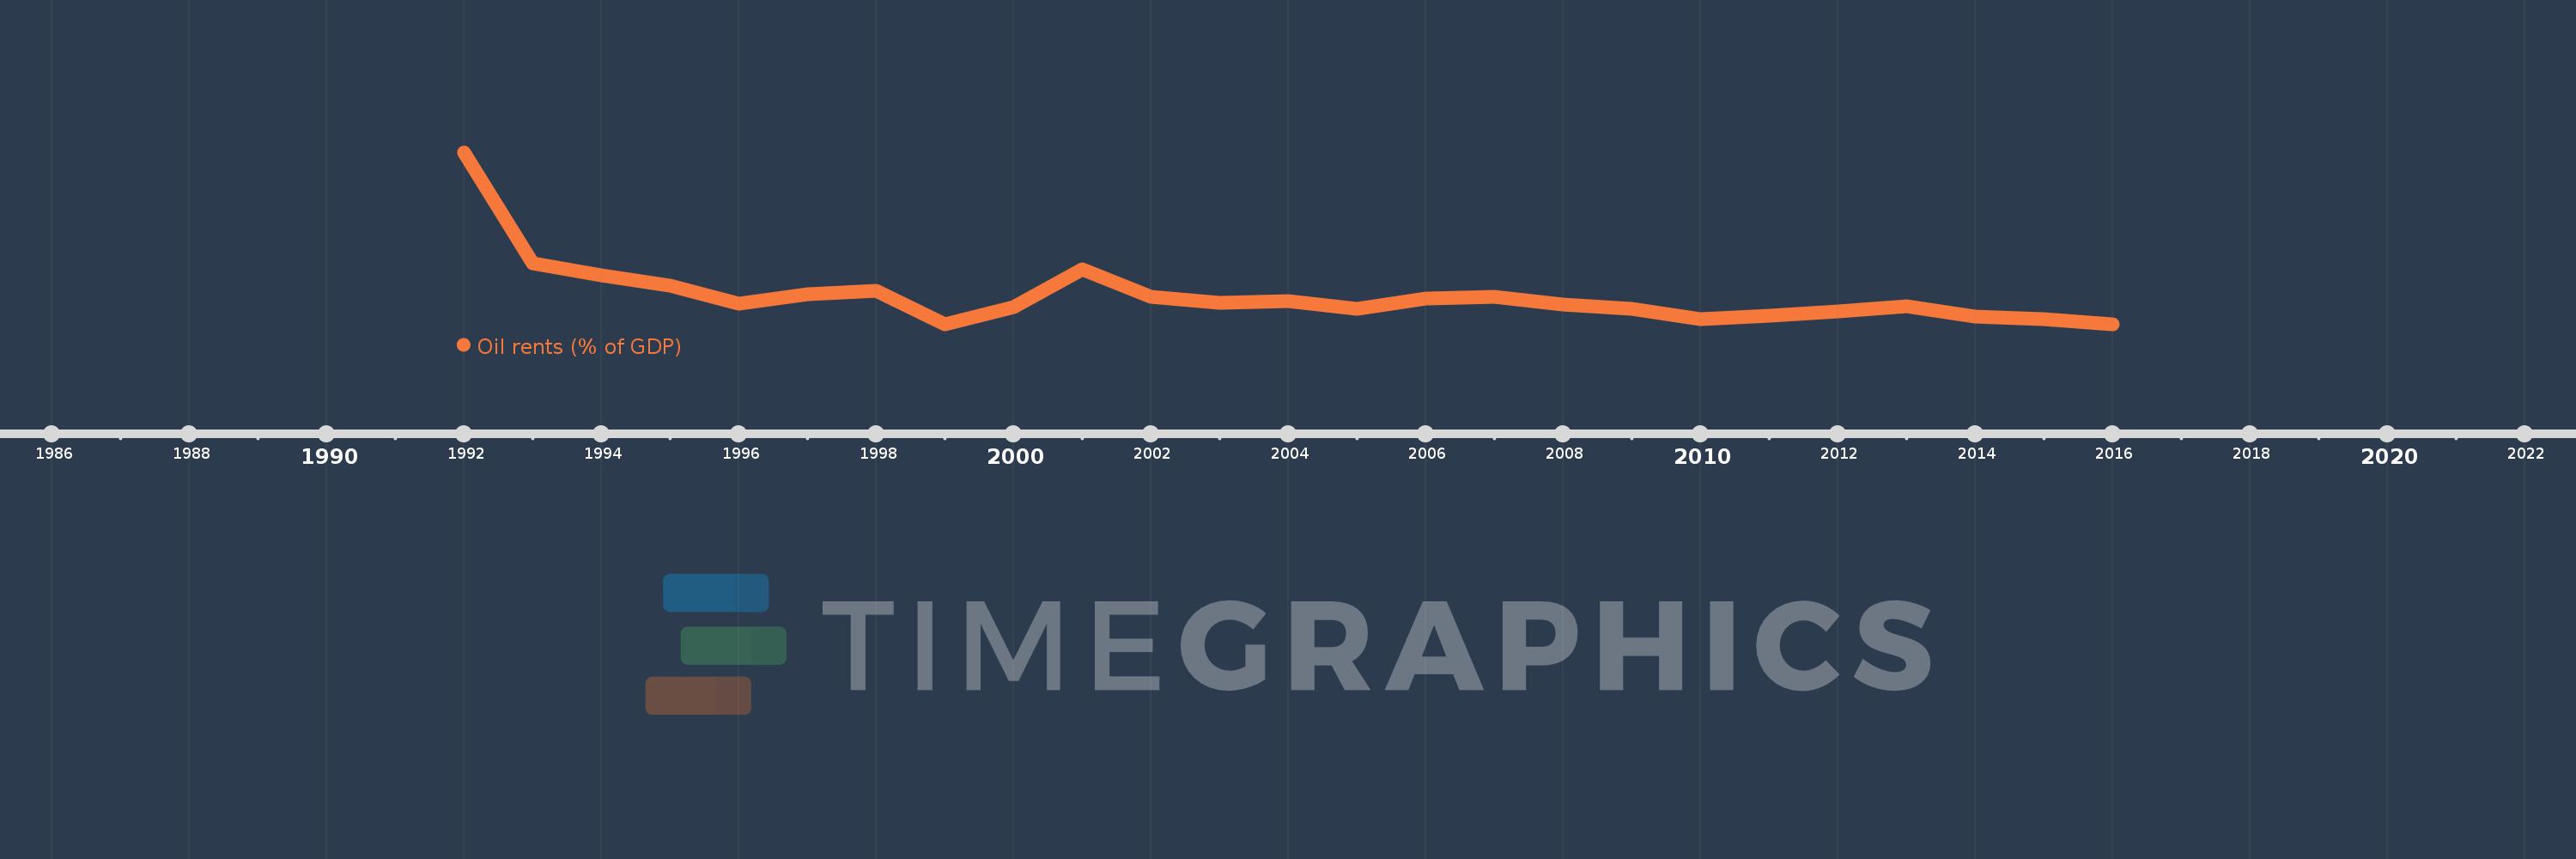
Oil rents (% of GDP)
2016,2015,2014,2013,2012,2011,2010,2009,2008,2007,2006,2005,2004,2003,2002,2001,2000,1999,1998,1997,1996,1995,1994,1993,1992
This statistics in other country:
Timeline:
This timeline shows a graph from 1992 to 2016 of Tajikistan. No data until 1991. Number of actual observations by date: 25.
Source name:
World Development Indicators
Source organization:
Estimates based on sources and methods described in "The Changing Wealth of Nations: Measuring Sustainable Development in the New Millennium" (World Bank, 2011).
Categories, topics:
Energy & Mining, Environment
Last updated:
apr 23, 2017
Indicators value changes by year
At the date of observation
Value
Absolute change
Change from previous value
jan 1, 1992
0.722
+0.722
0.0%
jan 1, 1993
0.269
-0.453
-62.77%
jan 1, 1994
0.217
-0.052
-19.3%
jan 1, 1995
0.175
-0.042
-19.2%
jan 1, 1996
0.103
-0.072
-41.34%
jan 1, 1997
0.142
+0.039
37.73%
jan 1, 1998
0.156
+0.014
10.06%
jan 1, 1999
0.018
-0.138
-88.53%
jan 1, 2000
0.089
+0.071
399.84%
jan 1, 2001
0.242
+0.152
170.53%
jan 1, 2002
0.13
-0.112
-46.37%
jan 1, 2003
0.104
-0.026
-20.03%
jan 1, 2004
0.113
+0.009
9.05%
jan 1, 2005
0.08
-0.033
-29.59%
jan 1, 2006
0.125
+0.045
56.48%
jan 1, 2007
0.131
+0.007
5.36%
jan 1, 2008
0.098
-0.033
-25.35%
jan 1, 2009
0.082
-0.016
-16.29%
jan 1, 2010
0.04
-0.042
-51.02%
jan 1, 2011
0.053
+0.013
31.5%
jan 1, 2012
0.069
+0.017
31.56%
jan 1, 2013
0.092
+0.023
32.75%
jan 1, 2014
0.05
-0.042
-45.41%
jan 1, 2015
0.04
-0.01
-19.91%
jan 1, 2016
0.018
-0.022
-54.65%
Ranking of countries by current statistics by years


Comments: