29
/
en
AIzaSyAYiBZKx7MnpbEhh9jyipgxe19OcubqV5w
April 1, 2024
157718
Iran, Islamic Rep.
IRN
true
2
1
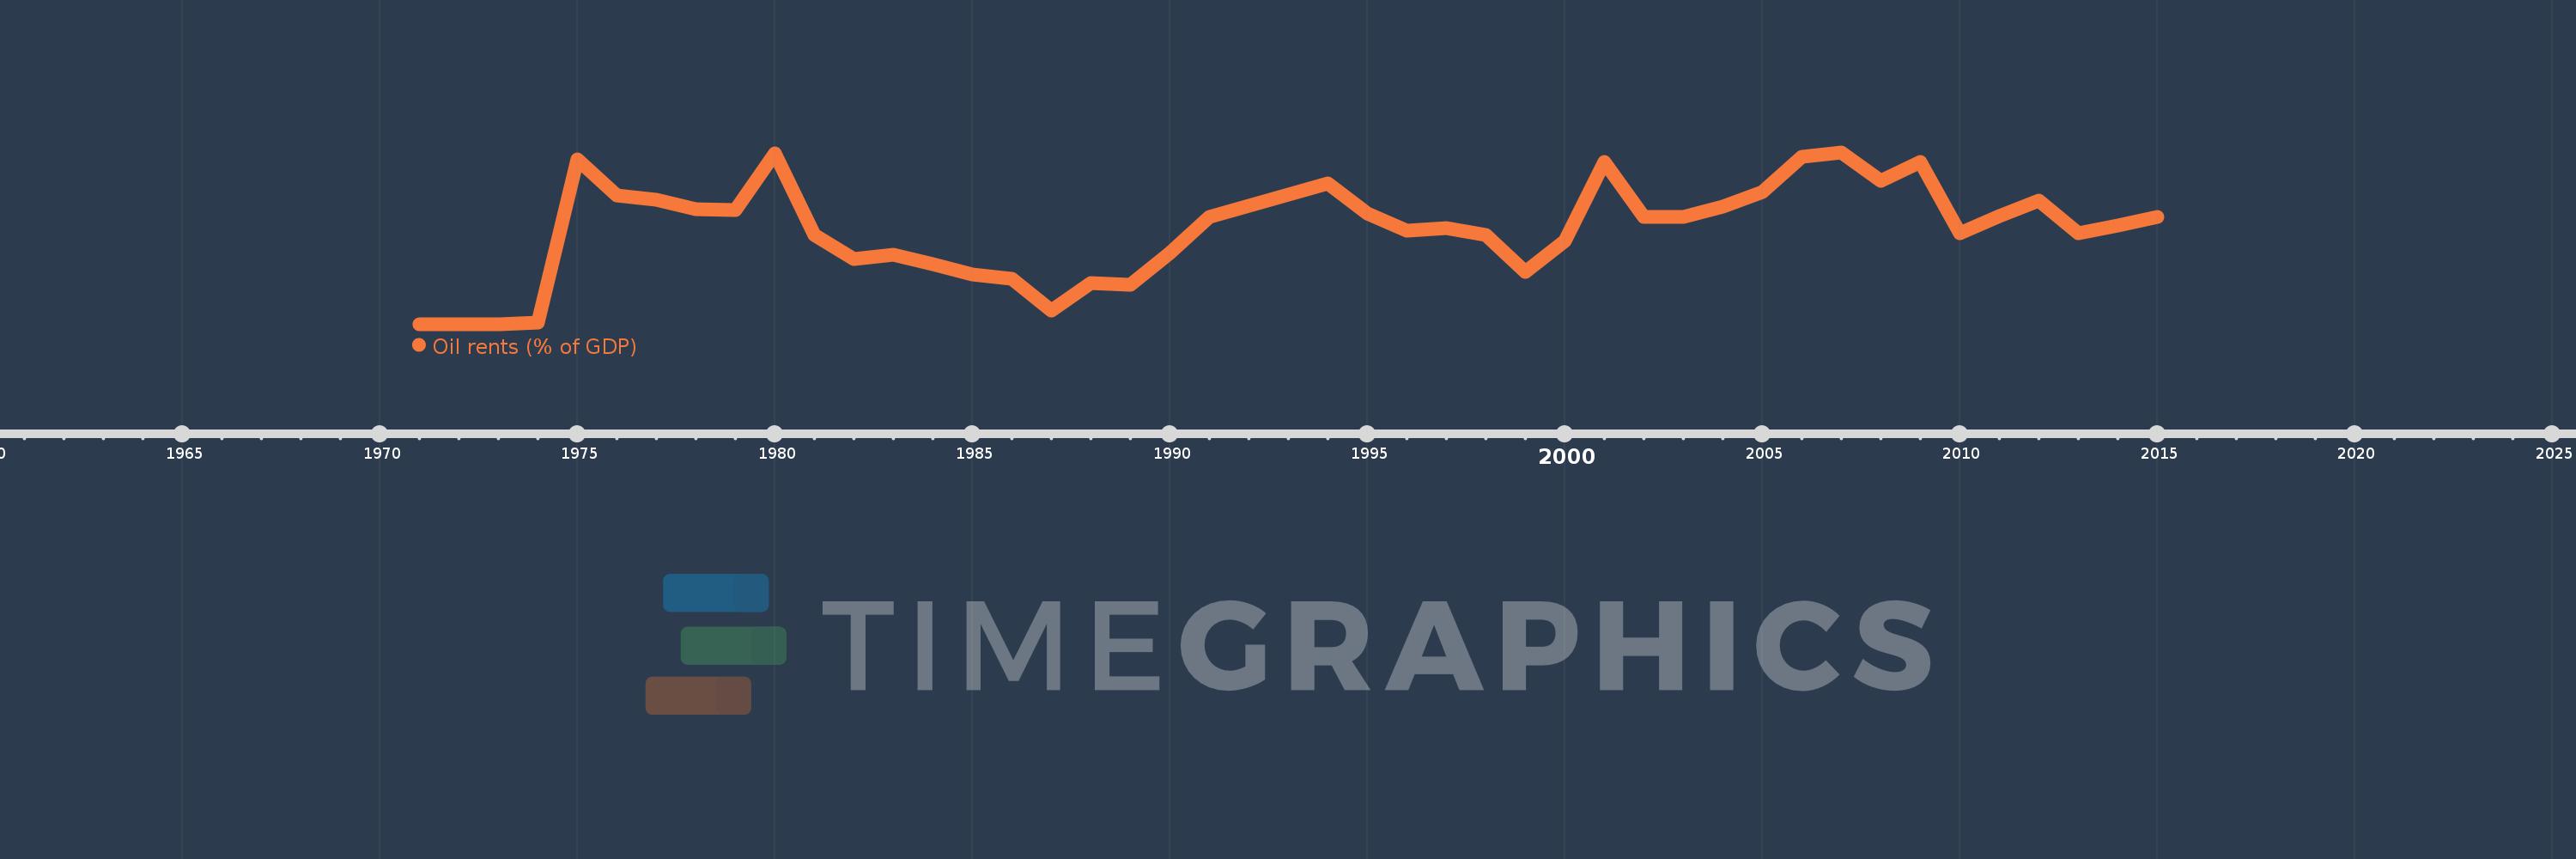
Oil rents (% of GDP)
2015,2014,2013,2012,2011,2010,2009,2008,2007,2006,2005,2004,2003,2002,2001,2000,1999,1998,1997,1996,1995,1994,1991,1990,1989,1988,1987,1986,1985,1984,1983,1982,1981,1980,1979,1978,1977,1976,1975,1974,1973,1972,1971
This statistics in other country:
Timeline:
This timeline shows a graph from 1971 to 2015 of Iran, Islamic Rep.. No data until 1970. Number of actual observations by date: 43.
Source name:
World Development Indicators
Source organization:
Estimates based on sources and methods described in "The Changing Wealth of Nations: Measuring Sustainable Development in the New Millennium" (World Bank, 2011).
Categories, topics:
Energy & Mining, Environment
Last updated:
apr 23, 2017
Indicators value changes by year
Maximum:
32.024
jan 1, 2007
At the date of observation
Value
Absolute change
Change from previous value
jan 1, 1971
0.073
+0.073
0.0%
jan 1, 1972
0.07
-0.003
-4.49%
jan 1, 1973
0.119
+0.049
69.97%
jan 1, 1974
0.304
+0.185
155.57%
jan 1, 1975
30.666
+30.361
9.98K%
jan 1, 1976
23.97
-6.696
-21.84%
jan 1, 1977
23.26
-0.709
-2.96%
jan 1, 1978
21.532
-1.729
-7.43%
jan 1, 1979
21.288
-0.244
-1.13%
jan 1, 1980
31.858
+10.569
49.65%
jan 1, 1981
16.72
-15.138
-47.52%
jan 1, 1982
12.12
-4.599
-27.51%
jan 1, 1983
13.054
+0.934
7.7%
jan 1, 1984
11.256
-1.798
-13.77%
jan 1, 1985
9.4
-1.856
-16.49%
jan 1, 1986
8.497
-0.903
-9.6%
jan 1, 1987
2.589
-5.909
-69.54%
jan 1, 1988
7.745
+5.156
199.19%
jan 1, 1989
7.369
-0.375
-4.85%
jan 1, 1990
13.357
+5.987
81.25%
jan 1, 1991
20.057
+6.7
50.16%
jan 1, 1994
26.23
+6.174
30.78%
jan 1, 1995
20.635
-5.595
-21.33%
jan 1, 1996
17.454
-3.181
-15.42%
jan 1, 1997
17.977
+0.522
2.99%
jan 1, 1998
16.671
-1.306
-7.26%
jan 1, 1999
9.774
-6.897
-41.37%
jan 1, 2000
15.537
+5.763
58.97%
jan 1, 2001
30.241
+14.704
94.64%
jan 1, 2002
20.05
-10.19
-33.7%
jan 1, 2003
19.972
-0.078
-0.39%
jan 1, 2004
21.867
+1.896
9.49%
jan 1, 2005
24.727
+2.859
13.08%
jan 1, 2006
31.139
+6.412
25.93%
jan 1, 2007
32.024
+0.885
2.84%
jan 1, 2008
26.711
-5.314
-16.59%
jan 1, 2009
30.171
+3.461
12.96%
jan 1, 2010
16.963
-13.208
-43.78%
jan 1, 2011
20.206
+3.243
19.12%
jan 1, 2012
23.009
+2.803
13.87%
jan 1, 2013
16.937
-6.072
-26.39%
jan 1, 2014
18.432
+1.495
8.83%
jan 1, 2015
19.96
+1.528
8.29%
Ranking of countries by current statistics by years


Comments: