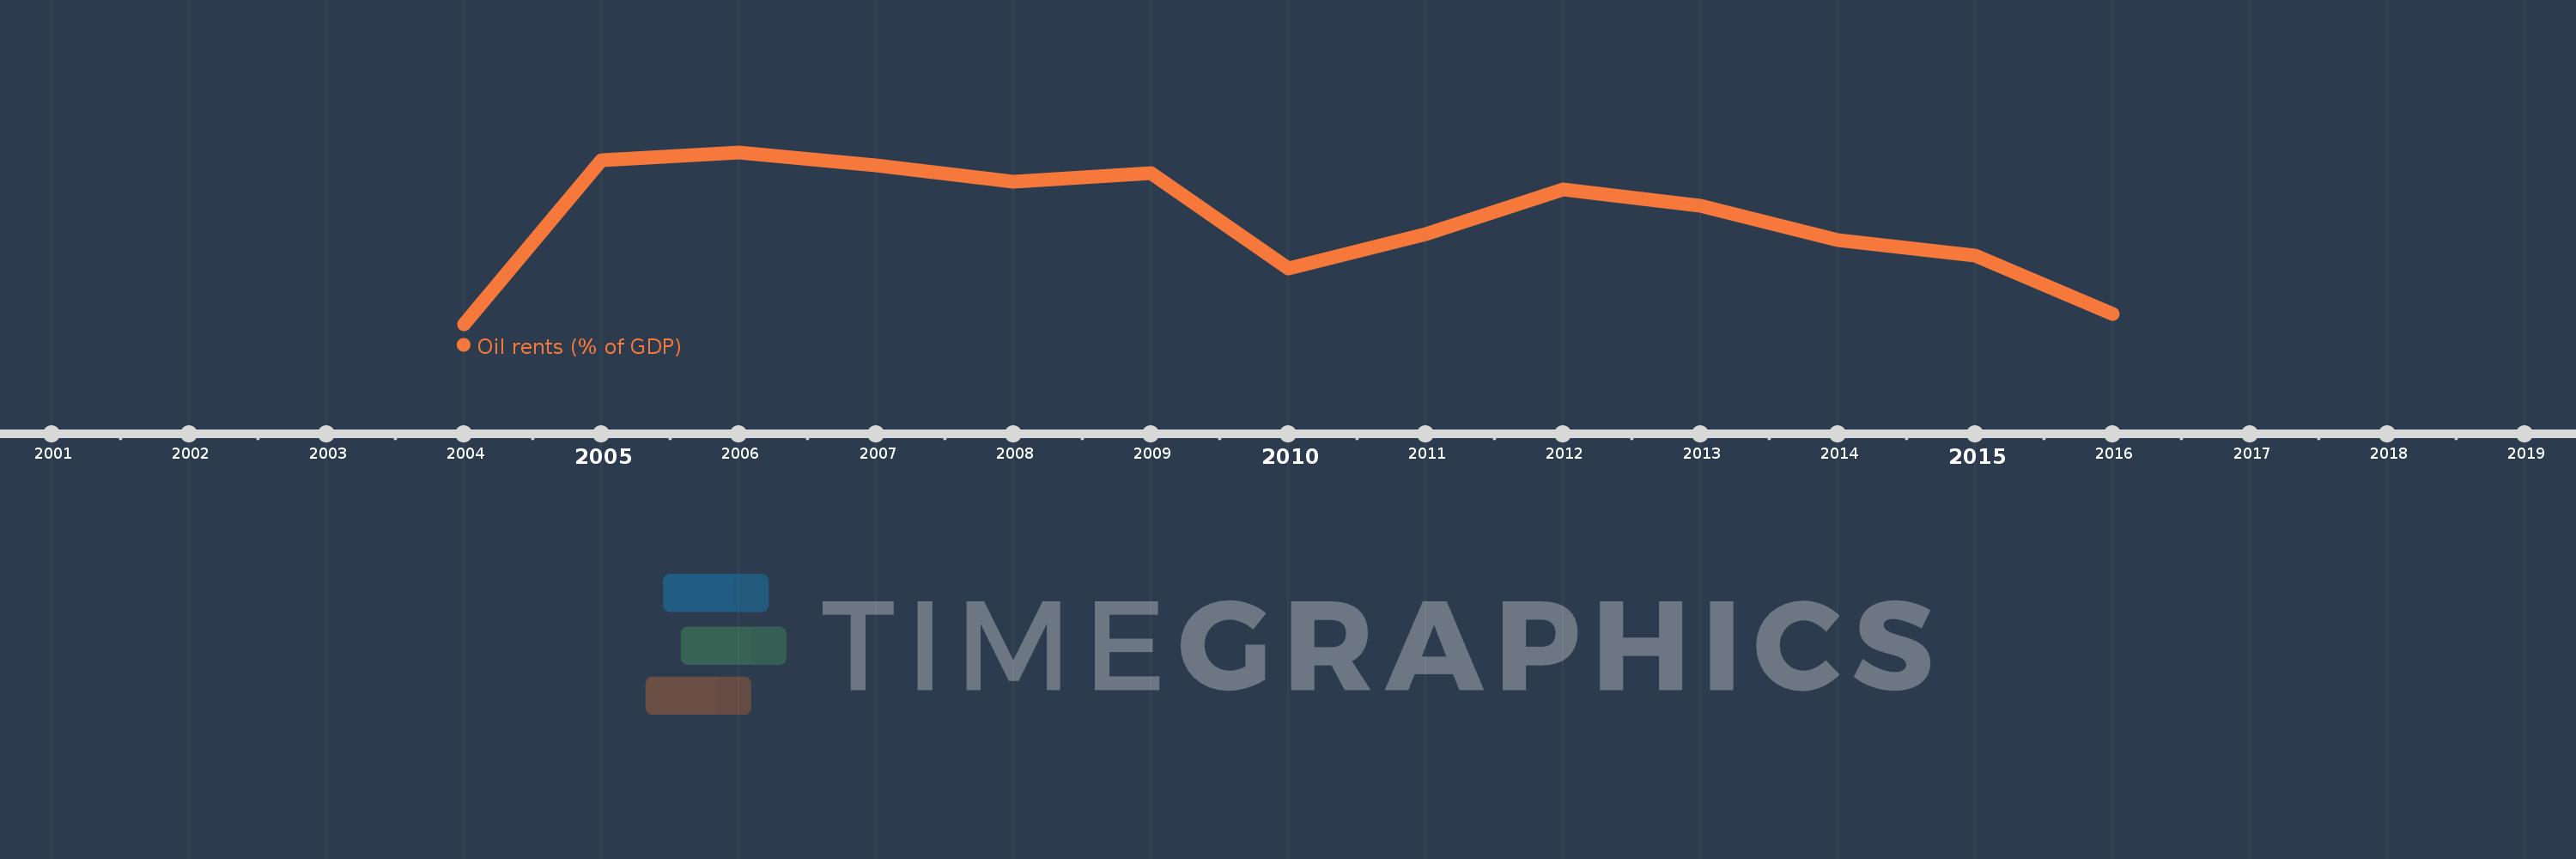
This timeline shows a graph from 2004 to 2016 of Chad. No data until 2003. Number of actual observations by date: 13.
Source name:
World Development Indicators
Source organization:
Estimates based on sources and methods described in "The Changing Wealth of Nations: Measuring Sustainable Development in the New Millennium" (World Bank, 2011).
Categories, topics:
Energy & Mining, Environment
Last updated:
apr 23, 2017
Indicators value changes by year
Meaning:
23.134
Minimum:
4.918
jan 1, 2004
Maximum:
35.032
jan 1, 2006
At the date of observation
Value
Absolute change
Change from the previous value
jan 1, 2004
4.918
+4.918
0.0%
jan 1, 2005
33.664
+28.745
584.48%
jan 1, 2006
35.032
+1.369
4.07%
jan 1, 2007
32.8
-2.232
-6.37%
jan 1, 2008
29.915
-2.885
-8.79%
jan 1, 2009
31.387
+1.472
4.92%
jan 1, 2010
14.704
-16.682
-53.15%
jan 1, 2011
20.735
+6.031
41.01%
jan 1, 2012
28.53
+7.795
37.59%
jan 1, 2013
25.657
-2.873
-10.07%
jan 1, 2014
19.709
-5.948
-23.18%
jan 1, 2015
16.912
-2.797
-14.19%
jan 1, 2016
6.776
-10.136
-59.93%
Ranking of countries by current statistics by years
