29
/
en
AIzaSyAYiBZKx7MnpbEhh9jyipgxe19OcubqV5w
April 1, 2024
51255
Middle income
MIC
false
2
1
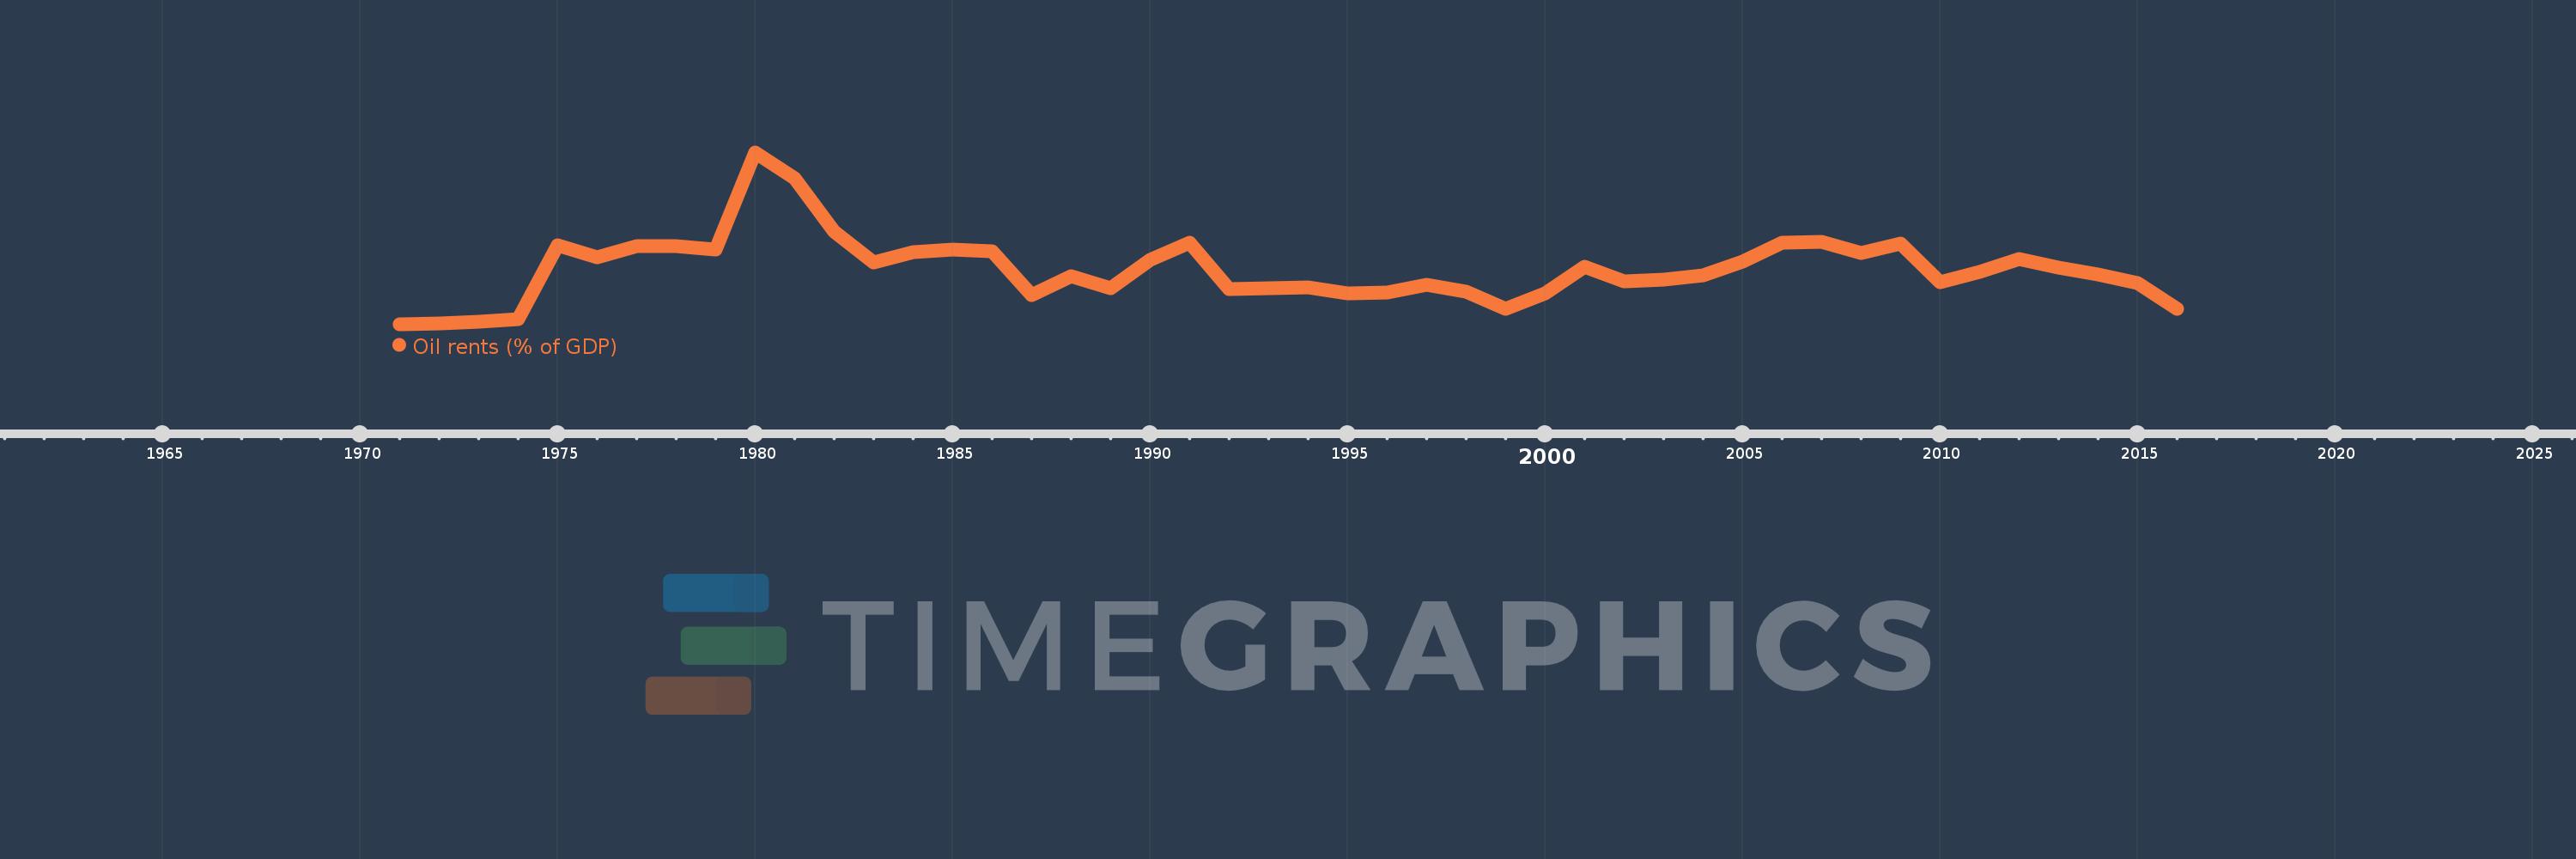
Oil rents (% of GDP)
2016,2015,2014,2013,2012,2011,2010,2009,2008,2007,2006,2005,2004,2003,2002,2001,2000,1999,1998,1997,1996,1995,1994,1993,1992,1991,1990,1989,1988,1987,1986,1985,1984,1983,1982,1981,1980,1979,1978,1977,1976,1975,1974,1973,1972,1971
This statistics in other country:
Timeline:
This timeline shows a graph from 1971 to 2016 of Middle income. No data until 1970. Number of actual observations by date: 46.
Source name:
World Development Indicators
Source organization:
Estimates based on sources and methods described in "The Changing Wealth of Nations: Measuring Sustainable Development in the New Millennium" (World Bank, 2011).
Categories, topics:
Energy & Mining, Environment
Last updated:
apr 23, 2017
Indicators value changes by year
Maximum:
13.043
jan 1, 1980
At the date of observation
Value
Absolute change
Change from previous value
jan 1, 1971
0.013
+0.013
0.0%
jan 1, 1972
0.057
+0.044
330.88%
jan 1, 1973
0.176
+0.119
210.32%
jan 1, 1974
0.417
+0.241
136.88%
jan 1, 1975
5.987
+5.57
1.34K%
jan 1, 1976
5.069
-0.917
-15.32%
jan 1, 1977
5.93
+0.861
16.98%
jan 1, 1978
5.967
+0.037
0.62%
jan 1, 1979
5.704
-0.263
-4.41%
jan 1, 1980
13.043
+7.339
128.67%
jan 1, 1981
11.07
-1.973
-15.12%
jan 1, 1982
7.054
-4.016
-36.28%
jan 1, 1983
4.69
-2.364
-33.51%
jan 1, 1984
5.501
+0.811
17.3%
jan 1, 1985
5.67
+0.169
3.07%
jan 1, 1986
5.533
-0.137
-2.41%
jan 1, 1987
2.217
-3.316
-59.93%
jan 1, 1988
3.683
+1.466
66.1%
jan 1, 1989
2.744
-0.939
-25.5%
jan 1, 1990
4.861
+2.117
77.17%
jan 1, 1991
6.217
+1.357
27.91%
jan 1, 1992
2.685
-3.533
-56.82%
jan 1, 1993
2.716
+0.032
1.18%
jan 1, 1994
2.811
+0.095
3.48%
jan 1, 1995
2.376
-0.435
-15.48%
jan 1, 1996
2.433
+0.057
2.41%
jan 1, 1997
2.999
+0.566
23.26%
jan 1, 1998
2.508
-0.491
-16.38%
jan 1, 1999
1.19
-1.318
-52.56%
jan 1, 2000
2.356
+1.166
98.03%
jan 1, 2001
4.394
+2.038
86.5%
jan 1, 2002
3.258
-1.136
-25.85%
jan 1, 2003
3.374
+0.116
3.57%
jan 1, 2004
3.707
+0.333
9.87%
jan 1, 2005
4.767
+1.06
28.58%
jan 1, 2006
6.168
+1.401
29.39%
jan 1, 2007
6.235
+0.067
1.09%
jan 1, 2008
5.393
-0.842
-13.51%
jan 1, 2009
6.152
+0.76
14.09%
jan 1, 2010
3.216
-2.937
-47.73%
jan 1, 2011
3.969
+0.753
23.42%
jan 1, 2012
4.932
+0.964
24.28%
jan 1, 2013
4.324
-0.609
-12.34%
jan 1, 2014
3.761
-0.563
-13.03%
jan 1, 2015
3.116
-0.645
-17.14%
jan 1, 2016
1.174
-1.942
-62.31%
Ranking of countries by current statistics by years


Comments: