29
/
en
AIzaSyAYiBZKx7MnpbEhh9jyipgxe19OcubqV5w
April 1, 2024
116117
Cuba
CUB
true
2
1
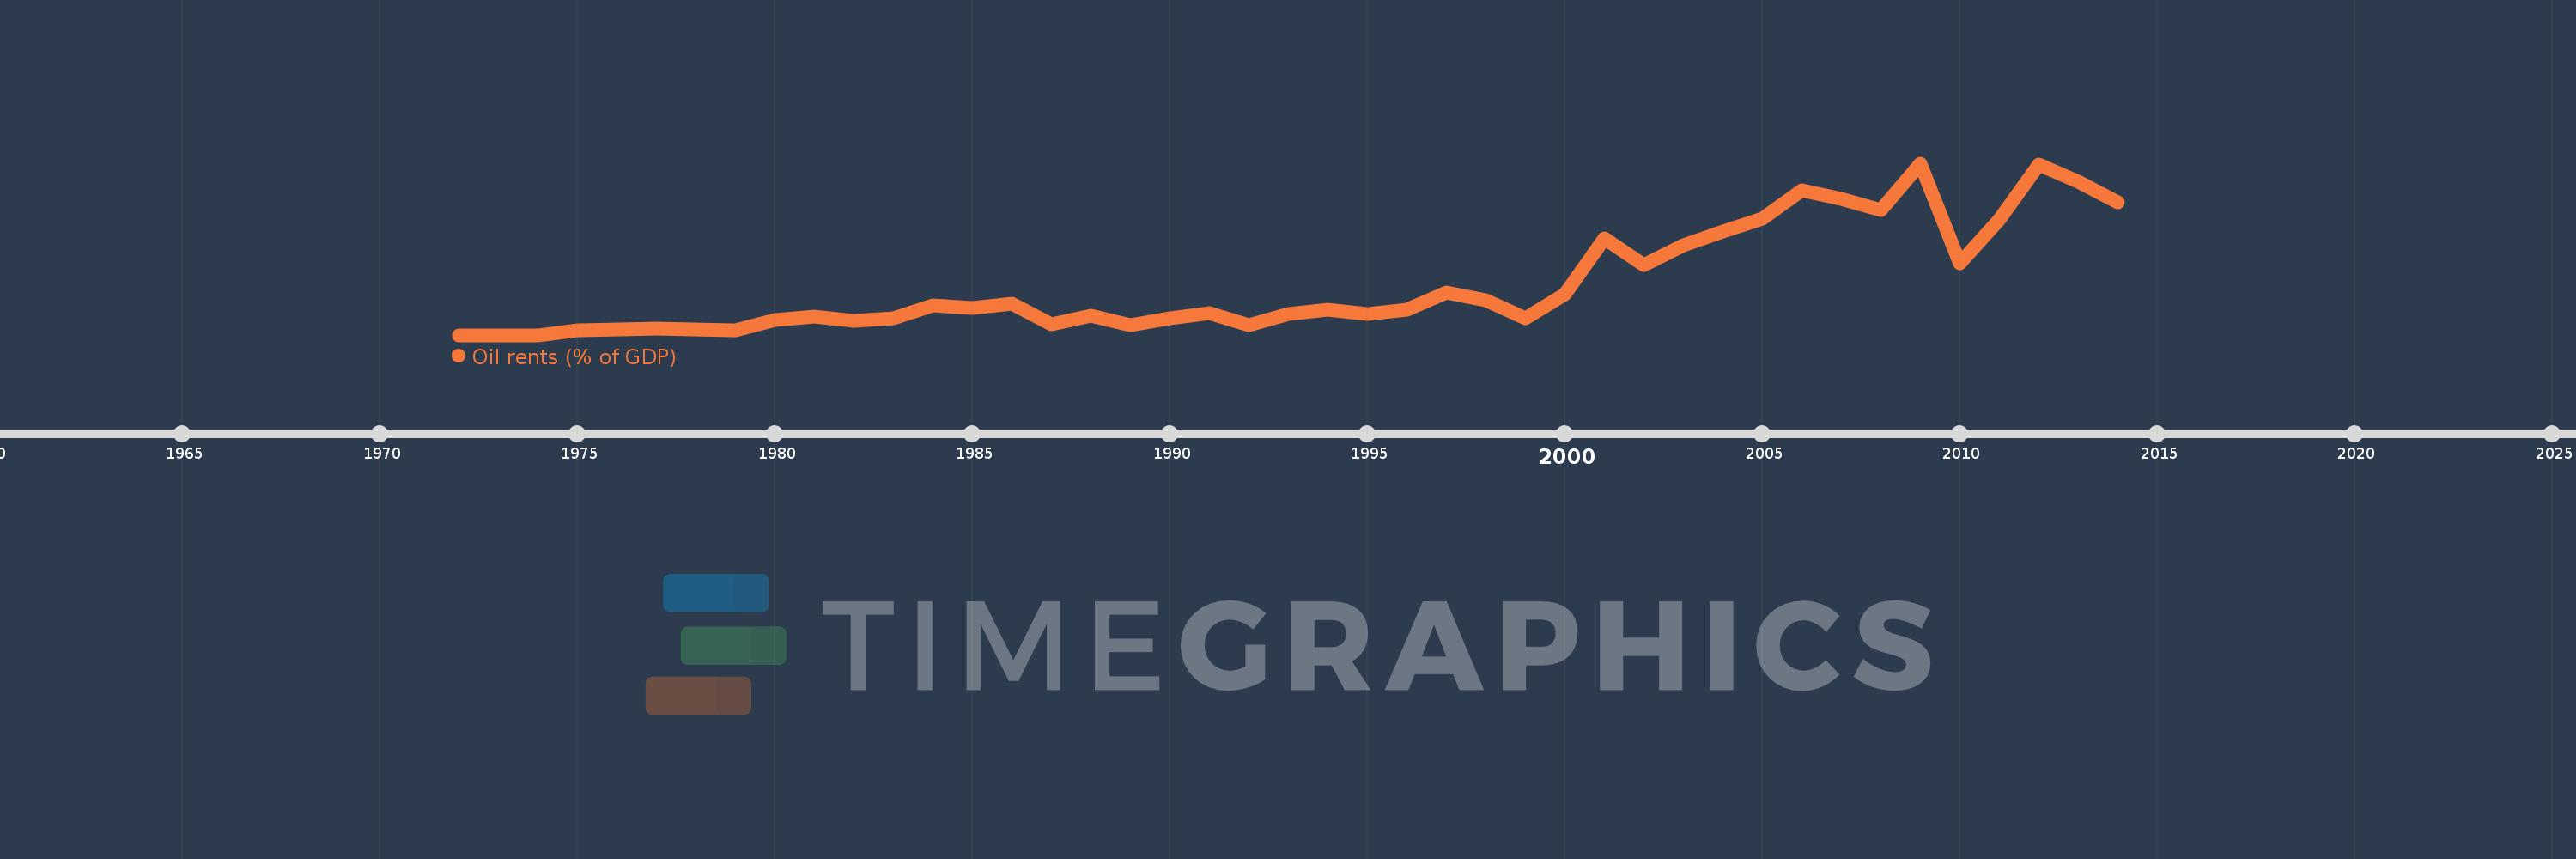
Oil rents (% of GDP)
2014,2013,2012,2011,2010,2009,2008,2007,2006,2005,2004,2003,2002,2001,2000,1999,1998,1997,1996,1995,1994,1993,1992,1991,1990,1989,1988,1987,1986,1985,1984,1983,1982,1981,1980,1979,1978,1977,1976,1975,1974,1973,1972
This statistics in other country:
Timeline:
This timeline shows a graph from 1972 to 2014 of Cuba. No data until 1971. Number of actual observations by date: 43.
Source name:
World Development Indicators
Source organization:
Estimates based on sources and methods described in "The Changing Wealth of Nations: Measuring Sustainable Development in the New Millennium" (World Bank, 2011).
Categories, topics:
Energy & Mining, Environment
Last updated:
apr 23, 2017
Indicators value changes by year
At the date of observation
Value
Absolute change
Change from previous value
jan 1, 1973
0.0
0.0
-13.04%
jan 1, 1974
0.0
+0.0
849.58%
jan 1, 1975
0.049
+0.048
38.94K%
jan 1, 1976
0.056
+0.007
15.38%
jan 1, 1977
0.064
+0.008
13.95%
jan 1, 1978
0.06
-0.004
-6.65%
jan 1, 1979
0.053
-0.007
-11.61%
jan 1, 1980
0.163
+0.11
209.1%
jan 1, 1981
0.2
+0.037
22.78%
jan 1, 1982
0.153
-0.047
-23.41%
jan 1, 1983
0.176
+0.022
14.64%
jan 1, 1984
0.316
+0.14
79.82%
jan 1, 1985
0.287
-0.029
-9.24%
jan 1, 1986
0.331
+0.045
15.62%
jan 1, 1987
0.115
-0.217
-65.37%
jan 1, 1988
0.202
+0.087
75.97%
jan 1, 1989
0.101
-0.101
-49.95%
jan 1, 1990
0.178
+0.077
76.05%
jan 1, 1991
0.232
+0.054
30.3%
jan 1, 1992
0.109
-0.123
-53.09%
jan 1, 1993
0.223
+0.115
105.34%
jan 1, 1994
0.267
+0.044
19.71%
jan 1, 1995
0.226
-0.042
-15.58%
jan 1, 1996
0.272
+0.046
20.56%
jan 1, 1997
0.448
+0.175
64.46%
jan 1, 1998
0.368
-0.079
-17.71%
jan 1, 1999
0.177
-0.191
-51.98%
jan 1, 2000
0.434
+0.257
145.18%
jan 1, 2001
1.03
+0.597
137.58%
jan 1, 2002
0.744
-0.286
-27.8%
jan 1, 2003
0.958
+0.214
28.79%
jan 1, 2004
1.1
+0.142
14.81%
jan 1, 2005
1.24
+0.141
12.79%
jan 1, 2006
1.542
+0.302
24.34%
jan 1, 2007
1.447
-0.096
-6.21%
jan 1, 2008
1.327
-0.119
-8.26%
jan 1, 2009
1.825
+0.498
37.51%
jan 1, 2010
0.764
-1.061
-58.12%
jan 1, 2011
1.229
+0.465
60.79%
jan 1, 2012
1.813
+0.584
47.57%
jan 1, 2013
1.628
-0.186
-10.24%
jan 1, 2014
1.407
-0.221
-13.57%
Ranking of countries by current statistics by years


Comments: