29
/
en
AIzaSyAYiBZKx7MnpbEhh9jyipgxe19OcubqV5w
April 1, 2024
213400
Nigeria
NGA
true
2
1
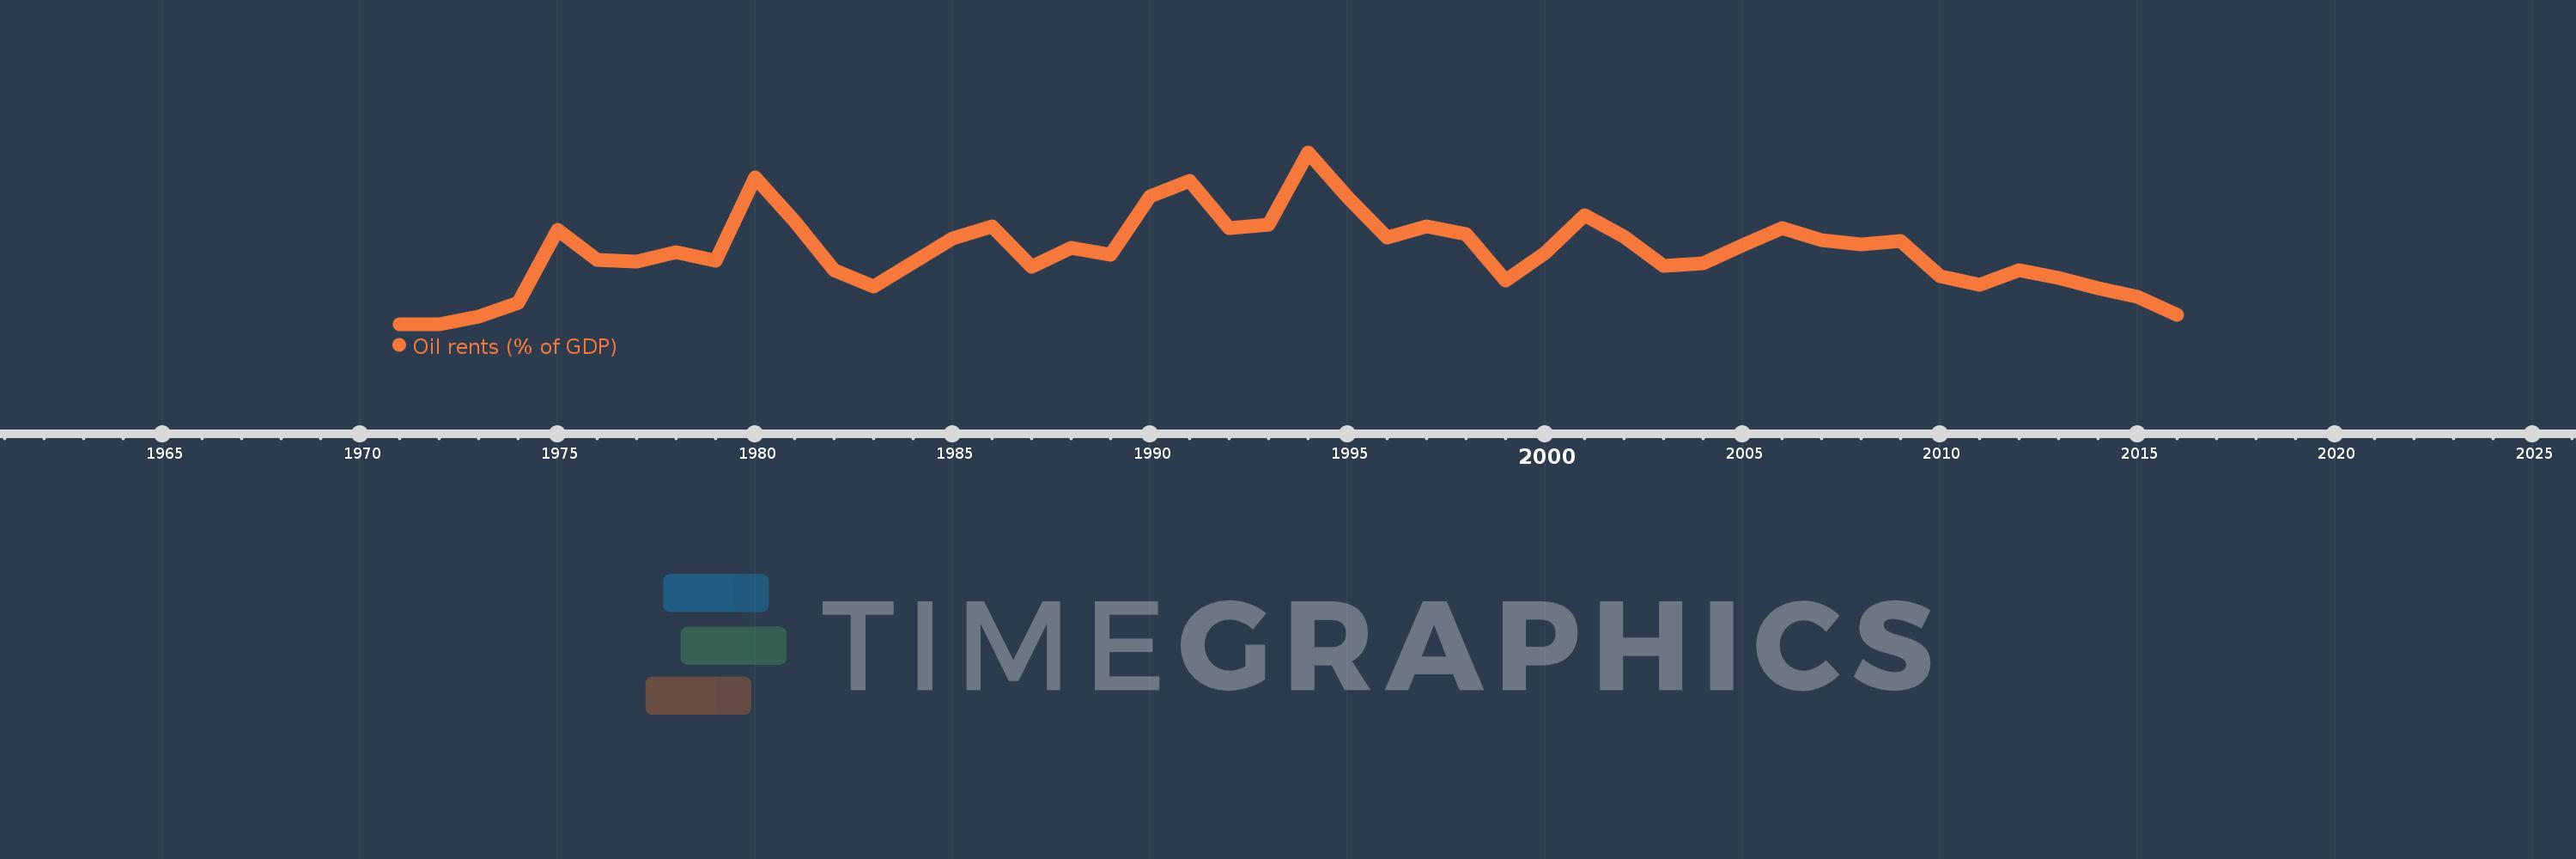
Oil rents (% of GDP)
2016,2015,2014,2013,2012,2011,2010,2009,2008,2007,2006,2005,2004,2003,2002,2001,2000,1999,1998,1997,1996,1995,1994,1993,1992,1991,1990,1989,1988,1987,1986,1985,1984,1983,1982,1981,1980,1979,1978,1977,1976,1975,1974,1973,1972,1971
This statistics in other country:
Timeline:
This timeline shows a graph from 1971 to 2016 of Nigeria. No data until 1970. Number of actual observations by date: 46.
Source name:
World Development Indicators
Source organization:
Estimates based on sources and methods described in "The Changing Wealth of Nations: Measuring Sustainable Development in the New Millennium" (World Bank, 2011).
Categories, topics:
Energy & Mining, Environment
Last updated:
apr 23, 2017
Indicators value changes by year
Maximum:
54.123
jan 1, 1994
At the date of observation
Value
Absolute change
Change from previous value
jan 1, 1973
2.437
+2.437
%
jan 1, 1974
6.794
+4.356
178.73%
jan 1, 1975
29.623
+22.829
336.03%
jan 1, 1976
20.238
-9.385
-31.68%
jan 1, 1977
19.704
-0.533
-2.64%
jan 1, 1978
22.683
+2.978
15.11%
jan 1, 1979
19.978
-2.705
-11.93%
jan 1, 1980
46.264
+26.286
131.58%
jan 1, 1981
32.453
-13.811
-29.85%
jan 1, 1982
17.145
-15.308
-47.17%
jan 1, 1983
11.989
-5.156
-30.07%
jan 1, 1984
19.518
+7.529
62.8%
jan 1, 1985
27.093
+7.575
38.81%
jan 1, 1986
30.777
+3.684
13.6%
jan 1, 1987
18.022
-12.755
-41.44%
jan 1, 1988
23.941
+5.919
32.85%
jan 1, 1989
21.968
-1.973
-8.24%
jan 1, 1990
40.326
+18.358
83.57%
jan 1, 1991
45.051
+4.725
11.72%
jan 1, 1992
30.229
-14.822
-32.9%
jan 1, 1993
31.478
+1.249
4.13%
jan 1, 1994
54.123
+22.645
71.94%
jan 1, 1995
40.076
-14.047
-25.95%
jan 1, 1996
27.314
-12.761
-31.84%
jan 1, 1997
30.879
+3.565
13.05%
jan 1, 1998
28.312
-2.567
-8.31%
jan 1, 1999
13.848
-14.464
-51.09%
jan 1, 2000
22.429
+8.581
61.96%
jan 1, 2001
34.328
+11.899
53.05%
jan 1, 2002
27.446
-6.881
-20.05%
jan 1, 2003
18.472
-8.975
-32.7%
jan 1, 2004
19.109
+0.637
3.45%
jan 1, 2005
24.862
+5.753
30.11%
jan 1, 2006
30.219
+5.357
21.55%
jan 1, 2007
26.59
-3.629
-12.01%
jan 1, 2008
25.151
-1.44
-5.42%
jan 1, 2009
26.163
+1.013
4.03%
jan 1, 2010
15.226
-10.937
-41.8%
jan 1, 2011
12.449
-2.777
-18.24%
jan 1, 2012
17.078
+4.629
37.18%
jan 1, 2013
14.697
-2.381
-13.94%
jan 1, 2014
11.331
-3.366
-22.9%
jan 1, 2015
8.657
-2.674
-23.6%
jan 1, 2016
3.038
-5.62
-64.91%
Ranking of countries by current statistics by years


Comments: