29
/
en
AIzaSyAYiBZKx7MnpbEhh9jyipgxe19OcubqV5w
April 1, 2024
47486
Lower middle income
LMC
false
2
1
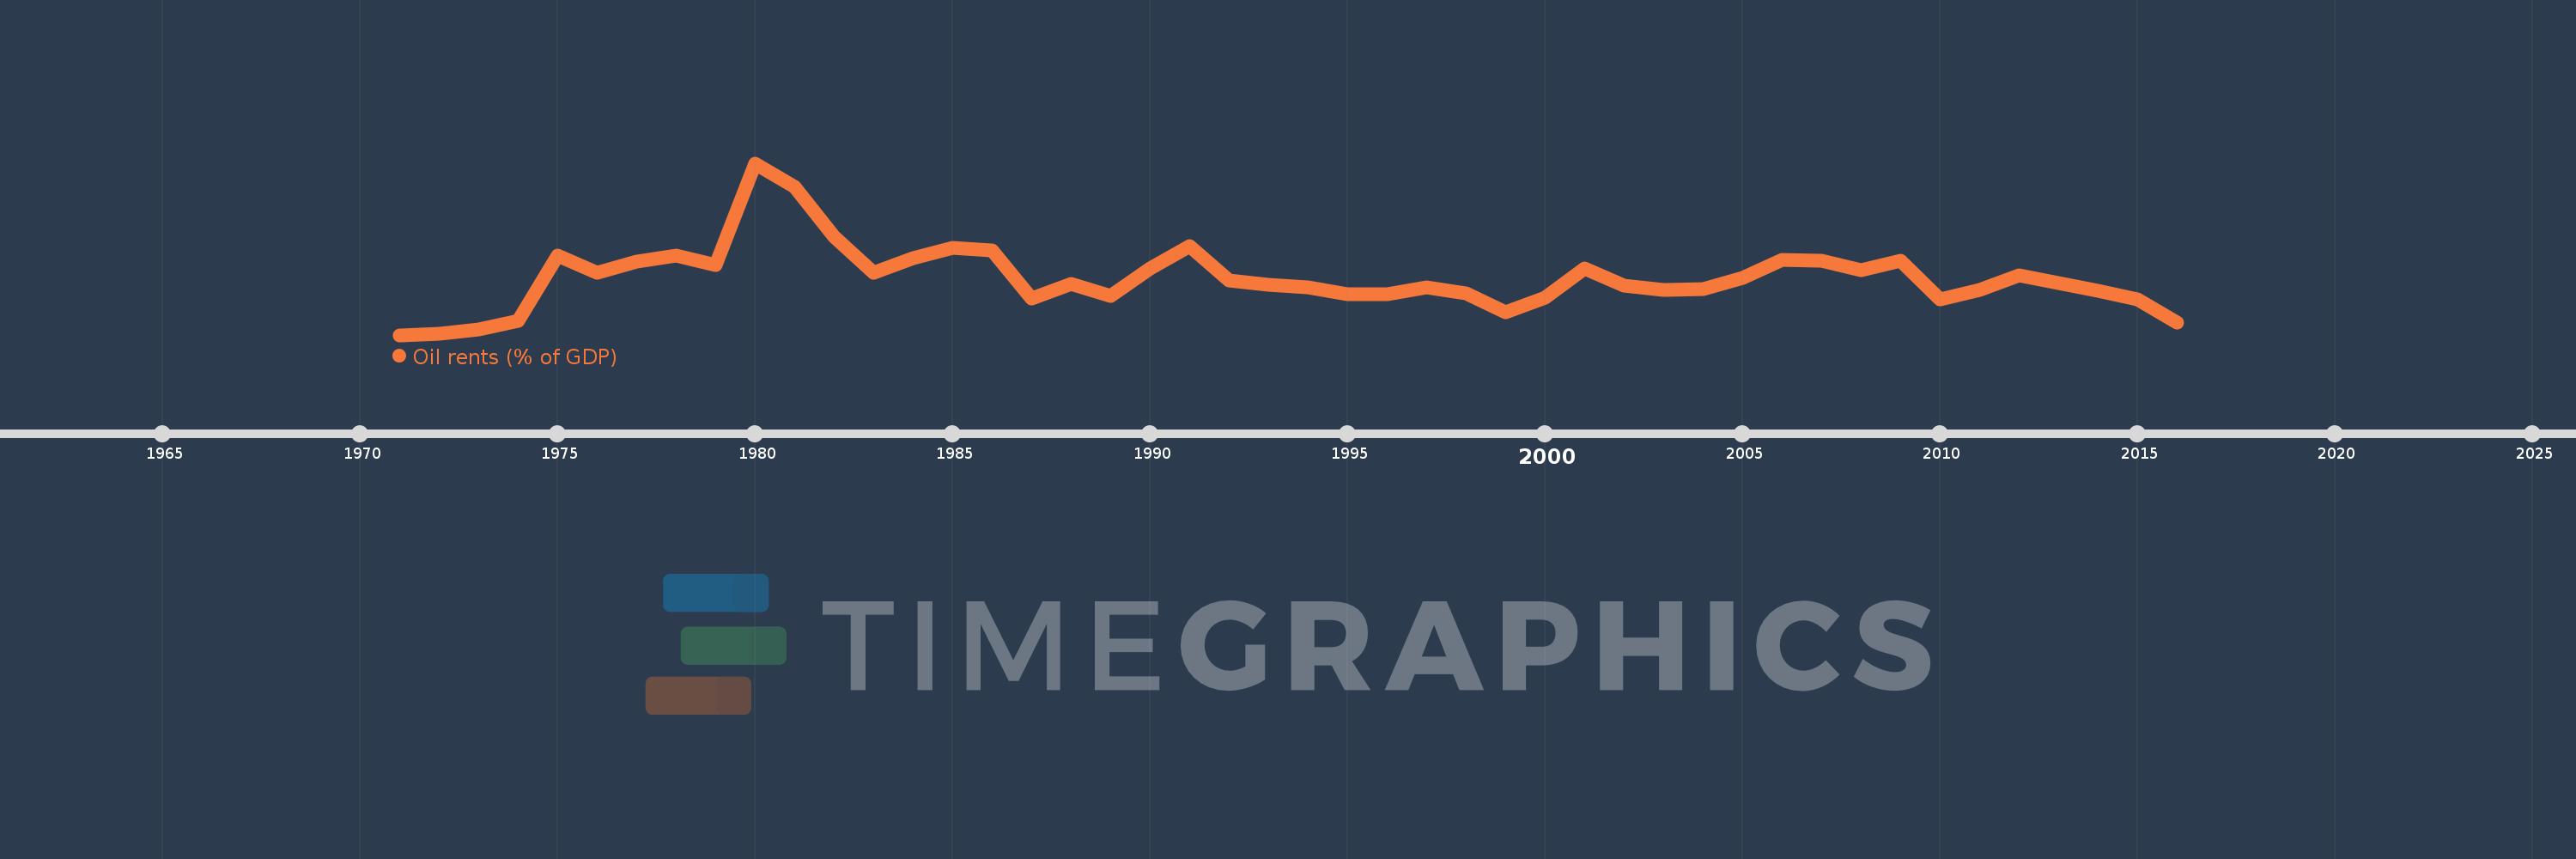
Oil rents (% of GDP)
2016,2015,2014,2013,2012,2011,2010,2009,2008,2007,2006,2005,2004,2003,2002,2001,2000,1999,1998,1997,1996,1995,1994,1993,1992,1991,1990,1989,1988,1987,1986,1985,1984,1983,1982,1981,1980,1979,1978,1977,1976,1975,1974,1973,1972,1971
This statistics in other country:
Timeline:
This timeline shows a graph from 1971 to 2016 of Lower middle income. No data until 1970. Number of actual observations by date: 46.
Source name:
World Development Indicators
Source organization:
Estimates based on sources and methods described in "The Changing Wealth of Nations: Measuring Sustainable Development in the New Millennium" (World Bank, 2011).
Categories, topics:
Energy & Mining, Environment
Last updated:
apr 23, 2017
Indicators value changes by year
Maximum:
11.037
jan 1, 1980
At the date of observation
Value
Absolute change
Change from previous value
jan 1, 1971
0.025
+0.025
0.0%
jan 1, 1972
0.087
+0.063
253.69%
jan 1, 1973
0.358
+0.27
310.06%
jan 1, 1974
0.917
+0.559
156.4%
jan 1, 1975
5.112
+4.195
457.56%
jan 1, 1976
4.011
-1.101
-21.53%
jan 1, 1977
4.744
+0.733
18.28%
jan 1, 1978
5.132
+0.388
8.17%
jan 1, 1979
4.5
-0.632
-12.32%
jan 1, 1980
11.037
+6.538
145.3%
jan 1, 1981
9.5
-1.537
-13.93%
jan 1, 1982
6.35
-3.15
-33.16%
jan 1, 1983
4.013
-2.336
-36.8%
jan 1, 1984
4.974
+0.961
23.94%
jan 1, 1985
5.614
+0.64
12.87%
jan 1, 1986
5.436
-0.178
-3.17%
jan 1, 1987
2.343
-3.093
-56.9%
jan 1, 1988
3.274
+0.931
39.73%
jan 1, 1989
2.513
-0.76
-23.23%
jan 1, 1990
4.289
+1.775
70.63%
jan 1, 1991
5.714
+1.425
33.23%
jan 1, 1992
3.526
-2.188
-38.3%
jan 1, 1993
3.268
-0.258
-7.3%
jan 1, 1994
3.101
-0.167
-5.12%
jan 1, 1995
2.618
-0.482
-15.56%
jan 1, 1996
2.613
-0.005
-0.21%
jan 1, 1997
3.063
+0.45
17.21%
jan 1, 1998
2.686
-0.377
-12.31%
jan 1, 1999
1.506
-1.179
-43.92%
jan 1, 2000
2.419
+0.913
60.61%
jan 1, 2001
4.286
+1.866
77.15%
jan 1, 2002
3.18
-1.106
-25.8%
jan 1, 2003
2.94
-0.24
-7.54%
jan 1, 2004
2.965
+0.025
0.85%
jan 1, 2005
3.696
+0.73
24.63%
jan 1, 2006
4.836
+1.14
30.85%
jan 1, 2007
4.791
-0.045
-0.93%
jan 1, 2008
4.209
-0.582
-12.15%
jan 1, 2009
4.808
+0.599
14.23%
jan 1, 2010
2.325
-2.483
-51.64%
jan 1, 2011
2.908
+0.583
25.08%
jan 1, 2012
3.847
+0.939
32.29%
jan 1, 2013
3.37
-0.477
-12.4%
jan 1, 2014
2.846
-0.524
-15.56%
jan 1, 2015
2.303
-0.543
-19.08%
jan 1, 2016
0.796
-1.507
-65.43%
Ranking of countries by current statistics by years


Comments: