29
/
en
AIzaSyAYiBZKx7MnpbEhh9jyipgxe19OcubqV5w
April 1, 2024
28470
East Asia & Pacific (excluding high income)
EAP
false
2
1
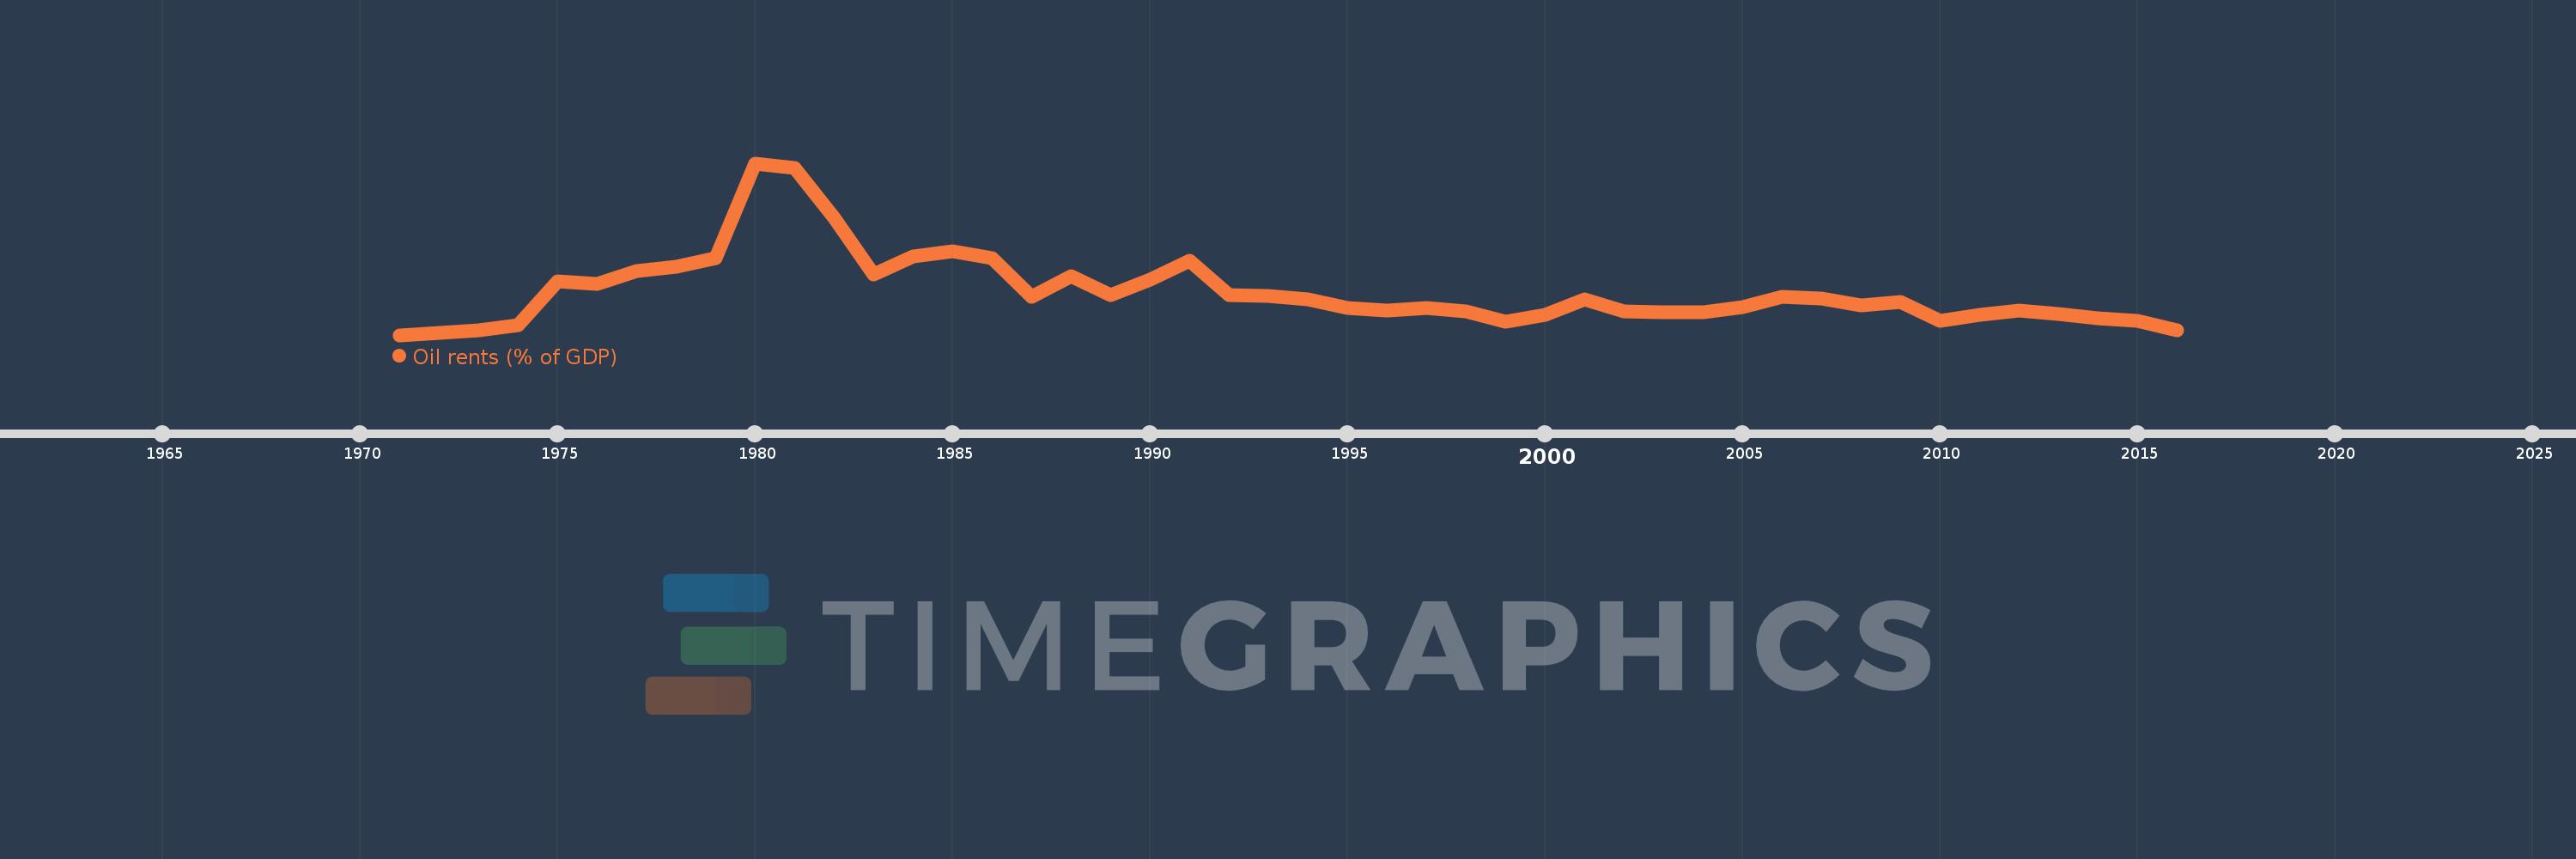
Oil rents (% of GDP)
2016,2015,2014,2013,2012,2011,2010,2009,2008,2007,2006,2005,2004,2003,2002,2001,2000,1999,1998,1997,1996,1995,1994,1993,1992,1991,1990,1989,1988,1987,1986,1985,1984,1983,1982,1981,1980,1979,1978,1977,1976,1975,1974,1973,1972,1971
This statistics in other country:
Timeline:
This timeline shows a graph from 1971 to 2016 of East Asia & Pacific (excluding high income). No data until 1970. Number of actual observations by date: 46.
Source name:
World Development Indicators
Source organization:
Estimates based on sources and methods described in "The Changing Wealth of Nations: Measuring Sustainable Development in the New Millennium" (World Bank, 2011).
Categories, topics:
Energy & Mining, Environment
Last updated:
apr 23, 2017
Indicators value changes by year
Maximum:
12.115
jan 1, 1980
At the date of observation
Value
Absolute change
Change from previous value
jan 1, 1972
0.146
+0.146
%
jan 1, 1973
0.321
+0.175
120.17%
jan 1, 1974
0.68
+0.359
111.87%
jan 1, 1975
3.765
+3.085
453.77%
jan 1, 1976
3.624
-0.141
-3.74%
jan 1, 1977
4.516
+0.891
24.6%
jan 1, 1978
4.829
+0.314
6.95%
jan 1, 1979
5.398
+0.568
11.76%
jan 1, 1980
12.115
+6.718
124.46%
jan 1, 1981
11.796
-0.319
-2.63%
jan 1, 1982
8.254
-3.543
-30.03%
jan 1, 1983
4.265
-3.989
-48.33%
jan 1, 1984
5.538
+1.273
29.85%
jan 1, 1985
5.929
+0.392
7.07%
jan 1, 1986
5.402
-0.528
-8.9%
jan 1, 1987
2.702
-2.7
-49.99%
jan 1, 1988
4.145
+1.444
53.44%
jan 1, 1989
2.825
-1.32
-31.86%
jan 1, 1990
3.929
+1.104
39.08%
jan 1, 1991
5.243
+1.314
33.46%
jan 1, 1992
2.799
-2.444
-46.62%
jan 1, 1993
2.785
-0.013
-0.48%
jan 1, 1994
2.51
-0.276
-9.89%
jan 1, 1995
1.911
-0.599
-23.87%
jan 1, 1996
1.724
-0.187
-9.76%
jan 1, 1997
1.917
+0.192
11.16%
jan 1, 1998
1.644
-0.272
-14.21%
jan 1, 1999
0.916
-0.728
-44.27%
jan 1, 2000
1.404
+0.488
53.22%
jan 1, 2001
2.506
+1.102
78.45%
jan 1, 2002
1.678
-0.827
-33.02%
jan 1, 2003
1.575
-0.103
-6.16%
jan 1, 2004
1.63
+0.055
3.5%
jan 1, 2005
1.993
+0.363
22.25%
jan 1, 2006
2.712
+0.719
36.07%
jan 1, 2007
2.597
-0.115
-4.24%
jan 1, 2008
2.074
-0.523
-20.13%
jan 1, 2009
2.358
+0.284
13.71%
jan 1, 2010
1.023
-1.336
-56.63%
jan 1, 2011
1.427
+0.404
39.55%
jan 1, 2012
1.733
+0.306
21.44%
jan 1, 2013
1.477
-0.256
-14.8%
jan 1, 2014
1.197
-0.28
-18.98%
jan 1, 2015
0.98
-0.216
-18.08%
jan 1, 2016
0.318
-0.663
-67.59%
Ranking of countries by current statistics by years


Comments: