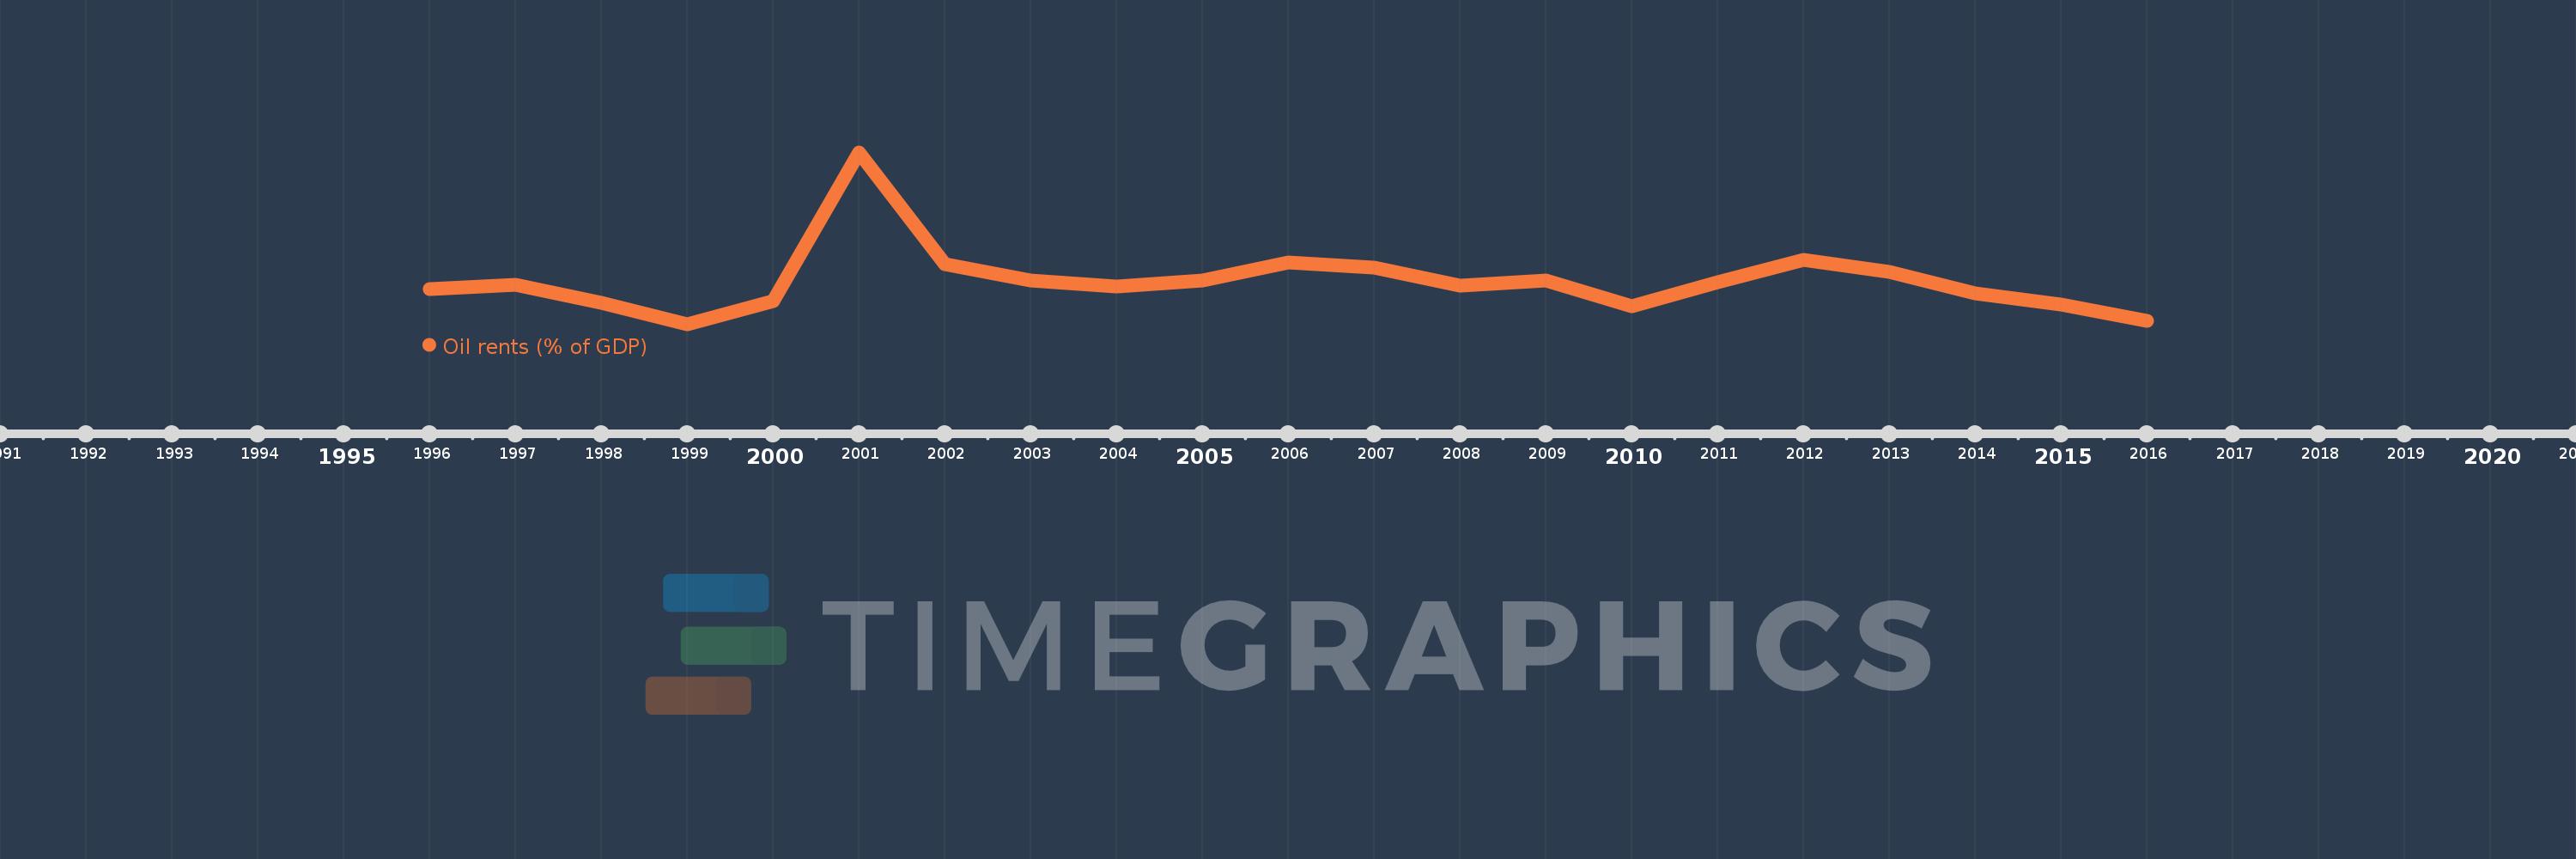
This timeline shows a graph from 1996 to 2016 of Serbia. No data until 1995. Number of actual observations by date: 21.
Source name:
World Development Indicators
Source organization:
Estimates based on sources and methods described in "The Changing Wealth of Nations: Measuring Sustainable Development in the New Millennium" (World Bank, 2011).
Categories, topics:
Energy & Mining, Environment
Last updated:
apr 23, 2017
Indicators value changes by year
Meaning:
0.394
Minimum:
0.057
jan 1, 1999
Maximum:
1.395
jan 1, 2001
At the date of observation
Value
Absolute change
Change from the previous value
jan 1, 1996
0.332
+0.332
0.0%
jan 1, 1997
0.367
+0.035
10.65%
jan 1, 1998
0.222
-0.146
-39.63%
jan 1, 1999
0.057
-0.164
-74.11%
jan 1, 2000
0.238
+0.18
313.96%
jan 1, 2001
1.395
+1.157
486.92%
jan 1, 2002
0.526
-0.869
-62.32%
jan 1, 2003
0.399
-0.127
-24.13%
jan 1, 2004
0.353
-0.046
-11.47%
jan 1, 2005
0.397
+0.044
12.47%
jan 1, 2006
0.535
+0.137
34.61%
jan 1, 2007
0.497
-0.038
-7.02%
jan 1, 2008
0.359
-0.138
-27.67%
jan 1, 2009
0.399
+0.04
11.11%
jan 1, 2010
0.197
-0.203
-50.71%
jan 1, 2011
0.387
+0.19
96.56%
jan 1, 2012
0.56
+0.173
44.72%
jan 1, 2013
0.463
-0.097
-17.32%
jan 1, 2014
0.295
-0.168
-36.21%
jan 1, 2015
0.211
-0.084
-28.58%
jan 1, 2016
0.083
-0.128
-60.87%
Ranking of countries by current statistics by years
