29
/
en
AIzaSyAYiBZKx7MnpbEhh9jyipgxe19OcubqV5w
April 1, 2024
69665
Argentina
ARG
true
2
1
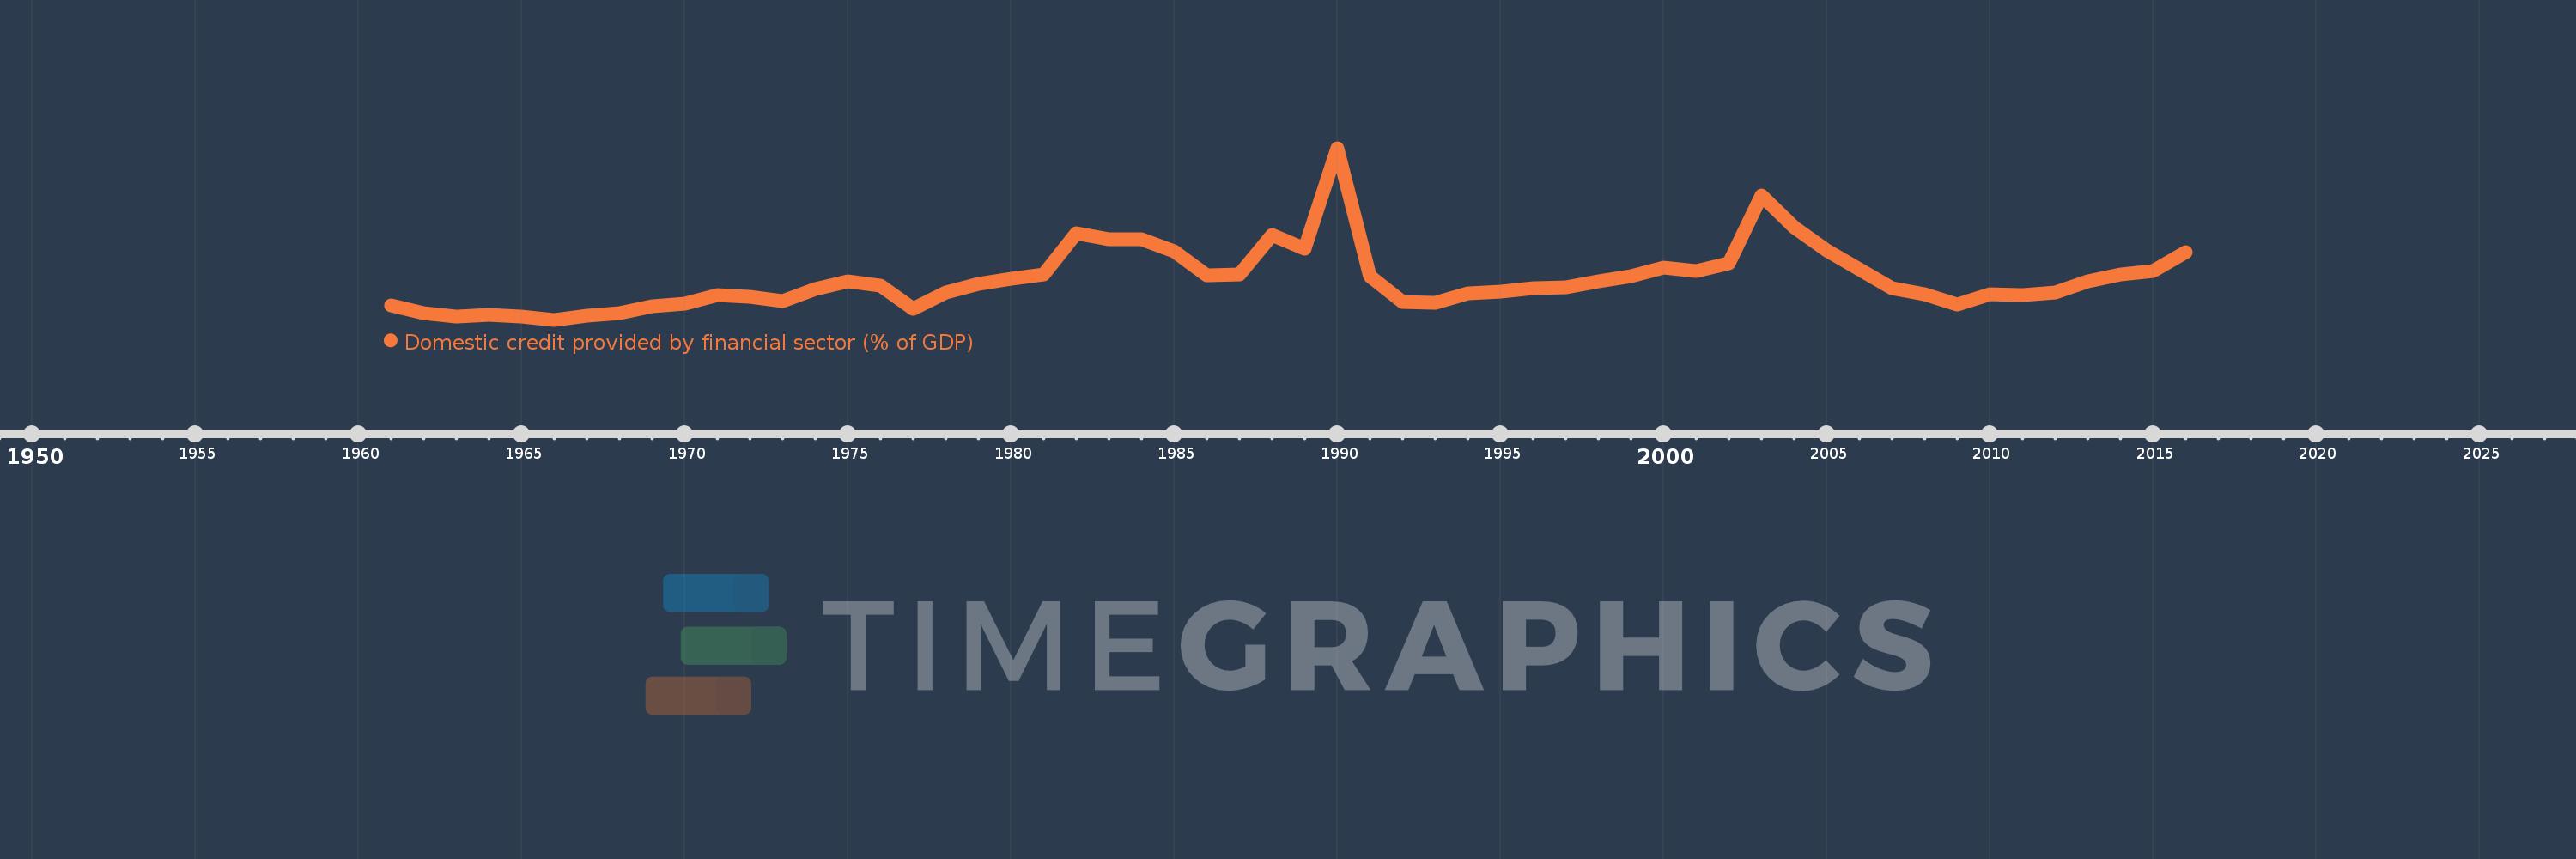
Domestic credit provided by financial sector (% of GDP)
2016,2015,2014,2013,2012,2011,2010,2009,2008,2007,2006,2005,2004,2003,2002,2001,2000,1999,1998,1997,1996,1995,1994,1993,1992,1991,1990,1989,1988,1987,1986,1985,1984,1983,1982,1981,1980,1979,1978,1977,1976,1975,1974,1973,1972,1971,1970,1969,1968,1967,1966,1965,1964,1963,1962,1961
This statistics in other country:
AfghanistanAlbaniaAlgeriaAngolaAntigua and BarbudaArab WorldArgentinaArmeniaArubaAustraliaAustriaAzerbaijanBahamas, TheBahrainBangladeshBarbadosBelarusBelgiumBelizeBeninBhutanBoliviaBosnia and HerzegovinaBotswanaBrazilBrunei DarussalamBulgariaBurkina FasoBurundiCabo VerdeCambodiaCameroonCanadaCaribbean small statesCentral African RepublicCentral Europe and the BalticsChadChileChinaColombiaComorosCongo, Dem. Rep.Congo, Rep.Costa RicaCote d'IvoireCroatiaCyprusCzech RepublicDenmarkDjiboutiDominicaDominican RepublicEarly-demographic dividendEast Asia & PacificEast Asia & Pacific (excluding high income)East Asia & Pacific (IDA & IBRD countries)EcuadorEgypt, Arab Rep.El SalvadorEquatorial GuineaEritreaEstoniaEthiopiaEuro areaEurope & Central AsiaEurope & Central Asia (excluding high income)Europe & Central Asia (IDA & IBRD countries)European UnionFijiFinlandFragile and conflict affected situationsFranceGabonGambia, TheGeorgiaGermanyGhanaGreeceGrenadaGuatemalaGuineaGuinea-BissauGuyanaHaitiHeavily indebted poor countries (HIPC)High incomeHondurasHong Kong SAR, ChinaHungaryIBRD onlyIcelandIDA & IBRD totalIDA blendIDA onlyIDA totalIndiaIndonesiaIran, Islamic Rep.IraqIrelandIsraelItalyJamaicaJapanJordanKazakhstanKenyaKorea, Rep.KosovoKuwaitKyrgyz RepublicLao PDRLate-demographic dividendLatin America & Caribbean Latin America & Caribbean (excluding high income)Latin America & the Caribbean (IDA & IBRD countries)LatviaLeast developed countries: UN classificationLebanonLesothoLiberiaLibyaLithuaniaLow & middle incomeLow incomeLower middle incomeLuxembourgMacao SAR, ChinaMacedonia, FYRMadagascarMalawiMalaysiaMaldivesMaliMaltaMauritaniaMauritiusMexicoMicronesia, Fed. Sts.Middle East & North AfricaMiddle East & North Africa (excluding high income)Middle East & North Africa (IDA & IBRD countries)Middle incomeMoldovaMongoliaMontenegroMoroccoMozambiqueMyanmarNamibiaNepalNetherlandsNew ZealandNicaraguaNigerNigeriaNorth AmericaNorwayOECD membersOmanOther small statesPacific island small statesPakistanPanamaPapua New GuineaParaguayPeruPhilippinesPolandPortugalPost-demographic dividendPre-demographic dividendQatarRomaniaRussian FederationRwandaSamoaSao Tome and PrincipeSaudi ArabiaSenegalSerbiaSeychellesSierra LeoneSingaporeSlovak RepublicSloveniaSmall statesSolomon IslandsSouth AfricaSouth AsiaSouth Asia (IDA & IBRD)South SudanSpainSri LankaSt. Kitts and NevisSt. LuciaSt. Vincent and the GrenadinesSub-Saharan Africa Sub-Saharan Africa (excluding high income)Sub-Saharan Africa (IDA & IBRD countries)SudanSurinameSwazilandSwedenSwitzerlandSyrian Arab RepublicTajikistanTanzaniaThailandTimor-LesteTogoTongaTrinidad and TobagoTunisiaTurkeyUgandaUkraineUnited Arab EmiratesUnited KingdomUnited StatesUpper middle incomeUruguayVanuatuVenezuela, RBVietnamWest Bank and GazaWorldYemen, Rep.ZambiaZimbabwe Timeline:
This timeline shows a graph from 1961 to 2016 of Argentina. No data until 1960. Number of actual observations by date: 56.
Source name:
World Development Indicators
Source organization:
International Monetary Fund, International Financial Statistics and data files, and World Bank and OECD GDP estimates.
Categories, topics:
Financial Sector
Last updated:
apr 23, 2017
Indicators value changes by year
Minimum:
16.187
jan 1, 1966
Maximum:
80.056
jan 1, 1990
At the date of observation
Value
Absolute change
Change from previous value
jan 1, 1961
21.672
+21.672
0.0%
jan 1, 1962
18.764
-2.907
-13.42%
jan 1, 1963
17.266
-1.498
-7.98%
jan 1, 1964
17.951
+0.685
3.97%
jan 1, 1965
17.442
-0.509
-2.83%
jan 1, 1966
16.187
-1.255
-7.2%
jan 1, 1967
17.68
+1.493
9.22%
jan 1, 1968
18.652
+0.971
5.49%
jan 1, 1969
21.15
+2.499
13.4%
jan 1, 1970
22.231
+1.081
5.11%
jan 1, 1971
25.204
+2.973
13.37%
jan 1, 1972
24.63
-0.574
-2.28%
jan 1, 1973
23.033
-1.597
-6.48%
jan 1, 1974
27.49
+4.457
19.35%
jan 1, 1975
30.371
+2.881
10.48%
jan 1, 1976
28.759
-1.612
-5.31%
jan 1, 1977
20.344
-8.415
-29.26%
jan 1, 1978
26.414
+6.07
29.83%
jan 1, 1979
29.372
+2.958
11.2%
jan 1, 1980
31.281
+1.909
6.5%
jan 1, 1981
32.96
+1.679
5.37%
jan 1, 1982
48.45
+15.49
47.0%
jan 1, 1983
45.999
-2.451
-5.06%
jan 1, 1984
46.21
+0.211
0.46%
jan 1, 1985
41.749
-4.461
-9.65%
jan 1, 1986
32.573
-9.176
-21.98%
jan 1, 1987
32.87
+0.297
0.91%
jan 1, 1988
47.586
+14.716
44.77%
jan 1, 1989
42.674
-4.911
-10.32%
jan 1, 1990
80.056
+37.381
87.6%
jan 1, 1991
32.421
-47.635
-59.5%
jan 1, 1992
22.799
-9.622
-29.68%
jan 1, 1993
22.479
-0.32
-1.41%
jan 1, 1994
25.994
+3.515
15.64%
jan 1, 1995
26.579
+0.585
2.25%
jan 1, 1996
27.868
+1.289
4.85%
jan 1, 1997
28.22
+0.352
1.26%
jan 1, 1998
30.376
+2.156
7.64%
jan 1, 1999
32.503
+2.127
7.0%
jan 1, 2000
35.504
+3.002
9.23%
jan 1, 2001
34.452
-1.053
-2.97%
jan 1, 2002
37.243
+2.792
8.1%
jan 1, 2003
62.421
+25.178
67.6%
jan 1, 2004
50.628
-11.793
-18.89%
jan 1, 2005
41.895
-8.733
-17.25%
jan 1, 2006
34.808
-7.087
-16.92%
jan 1, 2007
28.045
-6.763
-19.43%
jan 1, 2008
25.716
-2.329
-8.3%
jan 1, 2009
21.866
-3.85
-14.97%
jan 1, 2010
25.548
+3.682
16.84%
jan 1, 2011
25.196
-0.351
-1.38%
jan 1, 2012
26.315
+1.119
4.44%
jan 1, 2013
30.437
+4.121
15.66%
jan 1, 2014
33.06
+2.623
8.62%
jan 1, 2015
34.211
+1.151
3.48%
jan 1, 2016
41.231
+7.02
20.52%
Ranking of countries by current statistics by years


Comments: