29
/
en
AIzaSyAYiBZKx7MnpbEhh9jyipgxe19OcubqV5w
April 1, 2024
102342
Central African Republic
CAF
true
2
1
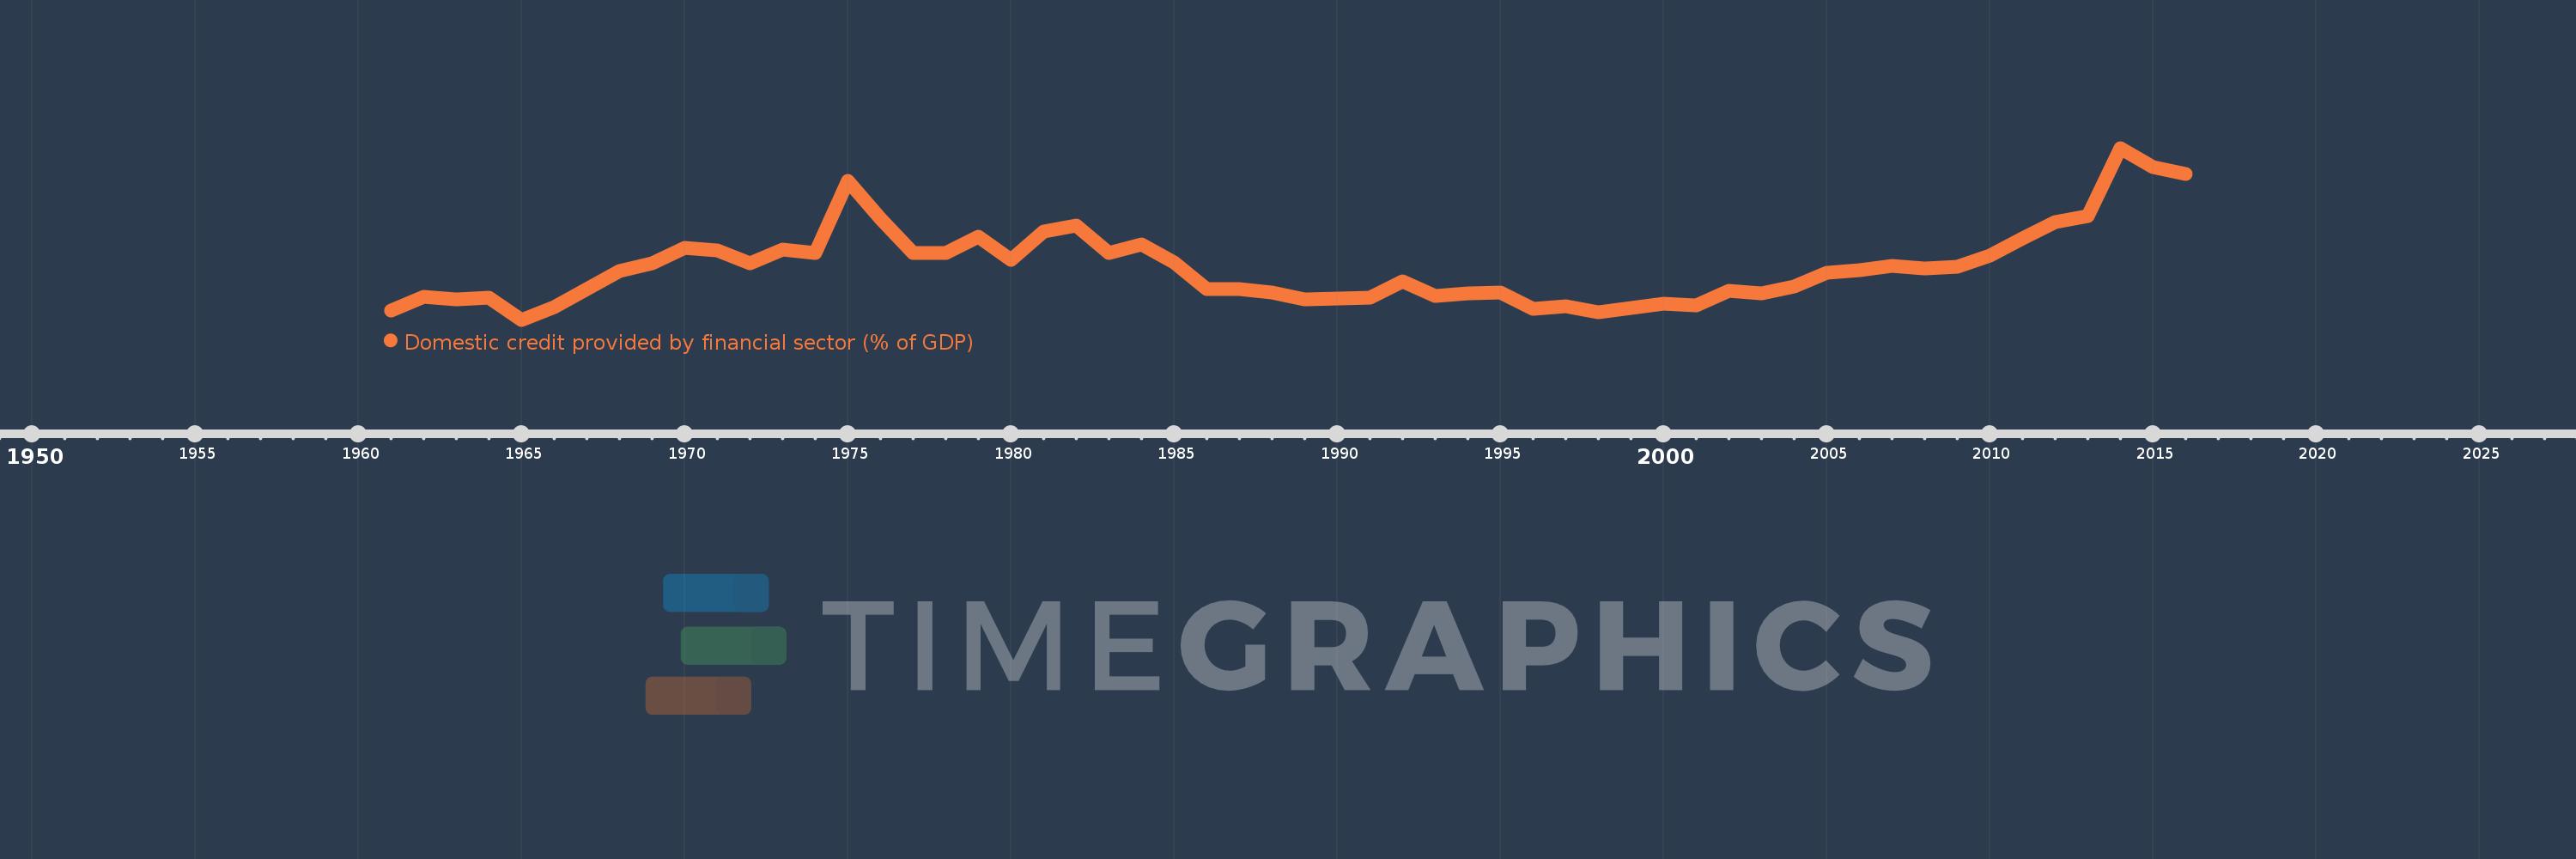
Domestic credit provided by financial sector (% of GDP)
2016,2015,2014,2013,2012,2011,2010,2009,2008,2007,2006,2005,2004,2003,2002,2001,2000,1999,1998,1997,1996,1995,1994,1993,1992,1991,1990,1989,1988,1987,1986,1985,1984,1983,1982,1981,1980,1979,1978,1977,1976,1975,1974,1973,1972,1971,1970,1969,1968,1967,1966,1965,1964,1963,1962,1961
This statistics in other country:
AfghanistanAlbaniaAlgeriaAngolaAntigua and BarbudaArab WorldArgentinaArmeniaArubaAustraliaAustriaAzerbaijanBahamas, TheBahrainBangladeshBarbadosBelarusBelgiumBelizeBeninBhutanBoliviaBosnia and HerzegovinaBotswanaBrazilBrunei DarussalamBulgariaBurkina FasoBurundiCabo VerdeCambodiaCameroonCanadaCaribbean small statesCentral African RepublicCentral Europe and the BalticsChadChileChinaColombiaComorosCongo, Dem. Rep.Congo, Rep.Costa RicaCote d'IvoireCroatiaCyprusCzech RepublicDenmarkDjiboutiDominicaDominican RepublicEarly-demographic dividendEast Asia & PacificEast Asia & Pacific (excluding high income)East Asia & Pacific (IDA & IBRD countries)EcuadorEgypt, Arab Rep.El SalvadorEquatorial GuineaEritreaEstoniaEthiopiaEuro areaEurope & Central AsiaEurope & Central Asia (excluding high income)Europe & Central Asia (IDA & IBRD countries)European UnionFijiFinlandFragile and conflict affected situationsFranceGabonGambia, TheGeorgiaGermanyGhanaGreeceGrenadaGuatemalaGuineaGuinea-BissauGuyanaHaitiHeavily indebted poor countries (HIPC)High incomeHondurasHong Kong SAR, ChinaHungaryIBRD onlyIcelandIDA & IBRD totalIDA blendIDA onlyIDA totalIndiaIndonesiaIran, Islamic Rep.IraqIrelandIsraelItalyJamaicaJapanJordanKazakhstanKenyaKorea, Rep.KosovoKuwaitKyrgyz RepublicLao PDRLate-demographic dividendLatin America & Caribbean Latin America & Caribbean (excluding high income)Latin America & the Caribbean (IDA & IBRD countries)LatviaLeast developed countries: UN classificationLebanonLesothoLiberiaLibyaLithuaniaLow & middle incomeLow incomeLower middle incomeLuxembourgMacao SAR, ChinaMacedonia, FYRMadagascarMalawiMalaysiaMaldivesMaliMaltaMauritaniaMauritiusMexicoMicronesia, Fed. Sts.Middle East & North AfricaMiddle East & North Africa (excluding high income)Middle East & North Africa (IDA & IBRD countries)Middle incomeMoldovaMongoliaMontenegroMoroccoMozambiqueMyanmarNamibiaNepalNetherlandsNew ZealandNicaraguaNigerNigeriaNorth AmericaNorwayOECD membersOmanOther small statesPacific island small statesPakistanPanamaPapua New GuineaParaguayPeruPhilippinesPolandPortugalPost-demographic dividendPre-demographic dividendQatarRomaniaRussian FederationRwandaSamoaSao Tome and PrincipeSaudi ArabiaSenegalSerbiaSeychellesSierra LeoneSingaporeSlovak RepublicSloveniaSmall statesSolomon IslandsSouth AfricaSouth AsiaSouth Asia (IDA & IBRD)South SudanSpainSri LankaSt. Kitts and NevisSt. LuciaSt. Vincent and the GrenadinesSub-Saharan Africa Sub-Saharan Africa (excluding high income)Sub-Saharan Africa (IDA & IBRD countries)SudanSurinameSwazilandSwedenSwitzerlandSyrian Arab RepublicTajikistanTanzaniaThailandTimor-LesteTogoTongaTrinidad and TobagoTunisiaTurkeyUgandaUkraineUnited Arab EmiratesUnited KingdomUnited StatesUpper middle incomeUruguayVanuatuVenezuela, RBVietnamWest Bank and GazaWorldYemen, Rep.ZambiaZimbabwe Timeline:
This timeline shows a graph from 1961 to 2016 of Central African Republic. No data until 1960. Number of actual observations by date: 56.
Source name:
World Development Indicators
Source organization:
International Monetary Fund, International Financial Statistics and data files, and World Bank and OECD GDP estimates.
Categories, topics:
Financial Sector
Last updated:
apr 23, 2017
Indicators value changes by year
Maximum:
37.116
jan 1, 2014
At the date of observation
Value
Absolute change
Change from previous value
jan 1, 1961
11.091
+11.091
0.0%
jan 1, 1962
13.411
+2.32
20.92%
jan 1, 1963
12.951
-0.46
-3.43%
jan 1, 1964
13.186
+0.235
1.82%
jan 1, 1965
9.684
-3.502
-26.56%
jan 1, 1966
11.707
+2.023
20.89%
jan 1, 1967
14.588
+2.88
24.6%
jan 1, 1968
17.419
+2.832
19.41%
jan 1, 1969
18.707
+1.287
7.39%
jan 1, 1970
21.169
+2.462
13.16%
jan 1, 1971
20.802
-0.367
-1.73%
jan 1, 1972
18.658
-2.143
-10.3%
jan 1, 1973
20.832
+2.173
11.65%
jan 1, 1974
20.363
-0.469
-2.25%
jan 1, 1975
31.891
+11.528
56.61%
jan 1, 1976
25.765
-6.126
-19.21%
jan 1, 1977
20.289
-5.475
-21.25%
jan 1, 1978
20.334
+0.044
0.22%
jan 1, 1979
22.885
+2.551
12.55%
jan 1, 1980
19.258
-3.627
-15.85%
jan 1, 1981
23.753
+4.495
23.34%
jan 1, 1982
24.785
+1.031
4.34%
jan 1, 1983
20.391
-4.393
-17.73%
jan 1, 1984
21.75
+1.359
6.66%
jan 1, 1985
18.889
-2.861
-13.15%
jan 1, 1986
14.567
-4.322
-22.88%
jan 1, 1987
14.574
+0.007
0.04%
jan 1, 1988
13.996
-0.578
-3.96%
jan 1, 1989
12.867
-1.13
-8.07%
jan 1, 1990
13.033
+0.166
1.29%
jan 1, 1991
13.169
+0.137
1.05%
jan 1, 1992
15.749
+2.579
19.58%
jan 1, 1993
13.517
-2.231
-14.17%
jan 1, 1994
13.905
+0.388
2.87%
jan 1, 1995
13.998
+0.093
0.67%
jan 1, 1996
11.376
-2.623
-18.74%
jan 1, 1997
11.798
+0.422
3.71%
jan 1, 1998
10.849
-0.949
-8.04%
jan 1, 1999
11.576
+0.727
6.7%
jan 1, 2000
12.274
+0.698
6.03%
jan 1, 2001
12.043
-0.231
-1.88%
jan 1, 2002
14.332
+2.289
19.01%
jan 1, 2003
13.866
-0.466
-3.25%
jan 1, 2004
15.003
+1.137
8.2%
jan 1, 2005
17.169
+2.166
14.43%
jan 1, 2006
17.559
+0.391
2.28%
jan 1, 2007
18.238
+0.679
3.87%
jan 1, 2008
17.911
-0.327
-1.79%
jan 1, 2009
18.185
+0.273
1.53%
jan 1, 2010
19.998
+1.814
9.97%
jan 1, 2011
22.656
+2.658
13.29%
jan 1, 2012
25.242
+2.586
11.41%
jan 1, 2013
26.262
+1.02
4.04%
jan 1, 2014
37.116
+10.854
41.33%
jan 1, 2015
34.031
-3.085
-8.31%
jan 1, 2016
33.001
-1.03
-3.03%
Ranking of countries by current statistics by years


Comments: