29
/
en
AIzaSyAYiBZKx7MnpbEhh9jyipgxe19OcubqV5w
April 1, 2024
107088
Colombia
COL
true
2
1
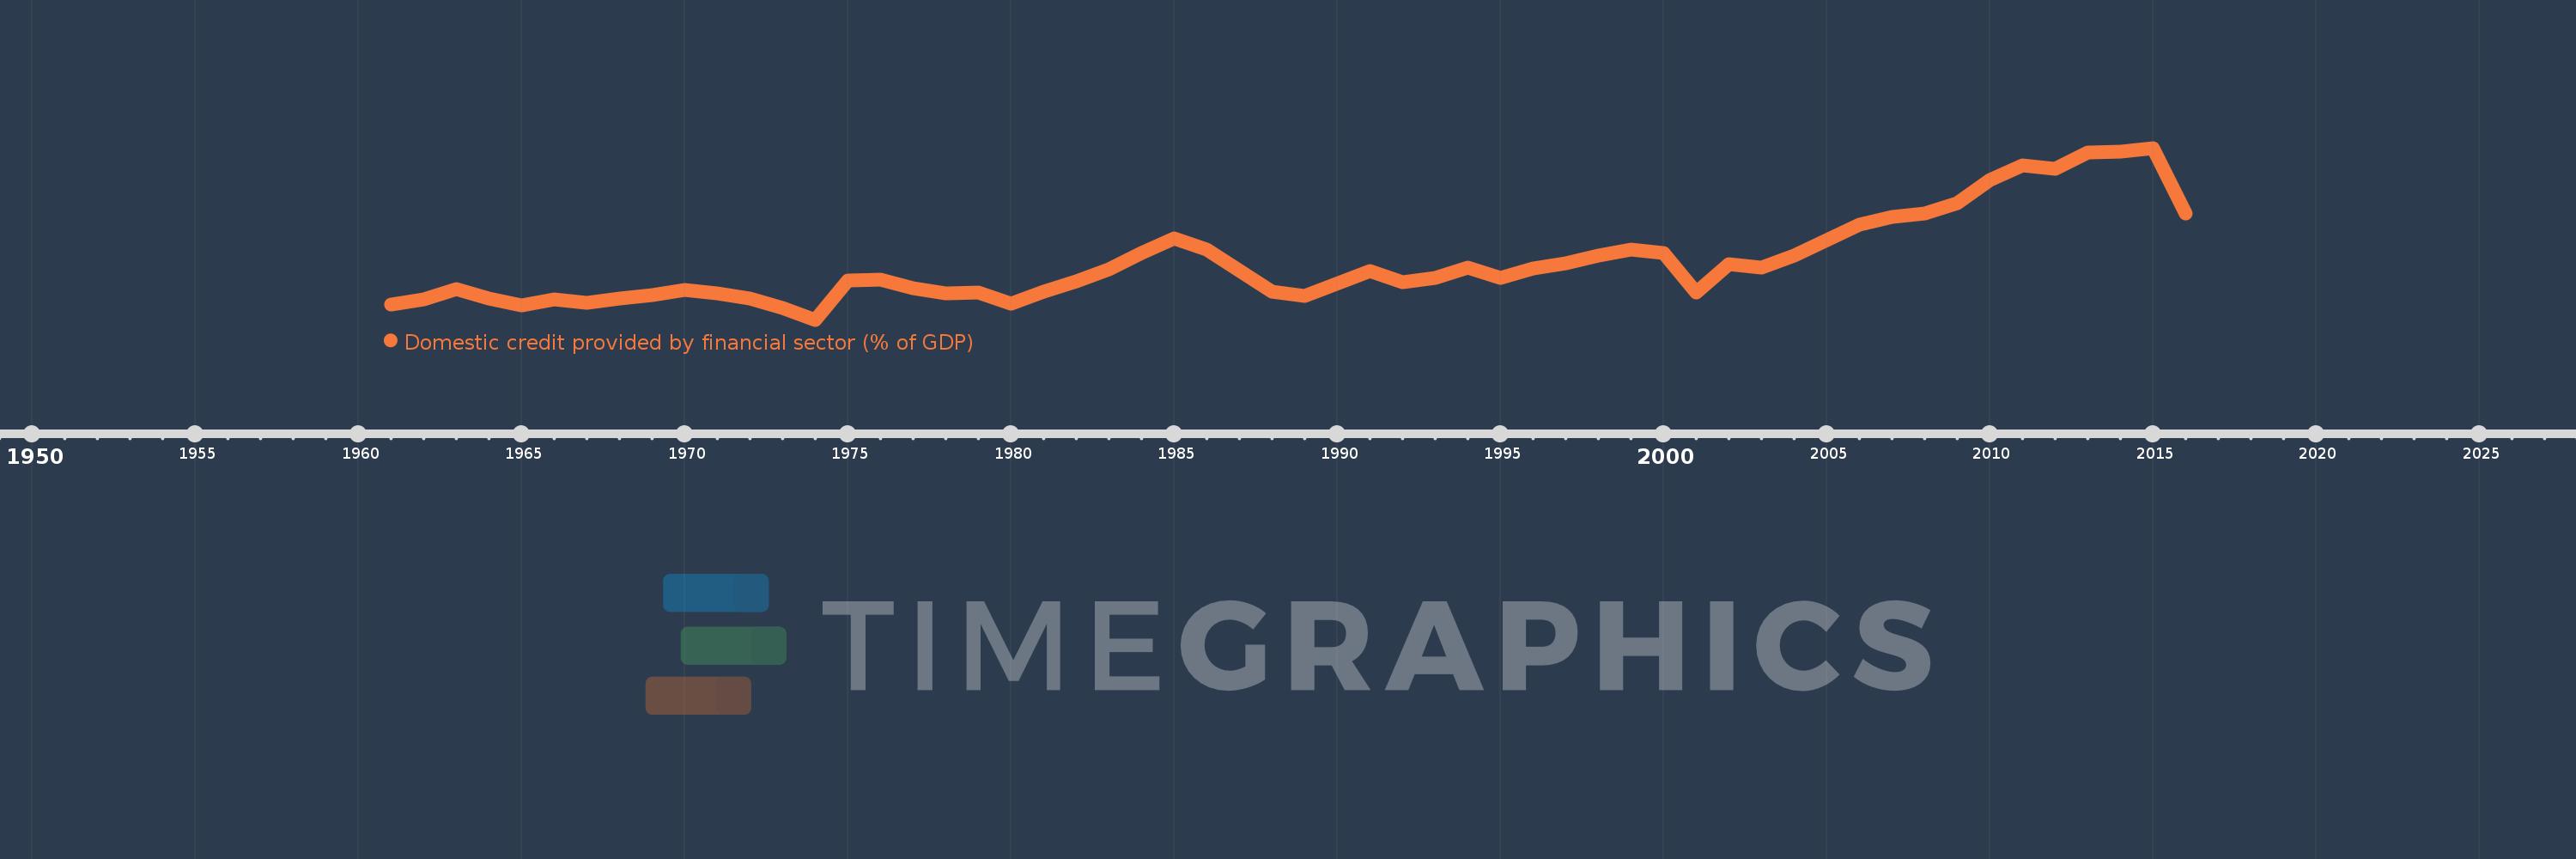
Domestic credit provided by financial sector (% of GDP)
2016,2015,2014,2013,2012,2011,2010,2009,2008,2007,2006,2005,2004,2003,2002,2001,2000,1999,1998,1997,1996,1995,1994,1993,1992,1991,1989,1988,1986,1985,1984,1983,1982,1981,1980,1979,1978,1977,1976,1975,1974,1973,1972,1971,1970,1969,1968,1967,1966,1965,1964,1963,1962,1961
This statistics in other country:
AfghanistanAlbaniaAlgeriaAngolaAntigua and BarbudaArab WorldArgentinaArmeniaArubaAustraliaAustriaAzerbaijanBahamas, TheBahrainBangladeshBarbadosBelarusBelgiumBelizeBeninBhutanBoliviaBosnia and HerzegovinaBotswanaBrazilBrunei DarussalamBulgariaBurkina FasoBurundiCabo VerdeCambodiaCameroonCanadaCaribbean small statesCentral African RepublicCentral Europe and the BalticsChadChileChinaColombiaComorosCongo, Dem. Rep.Congo, Rep.Costa RicaCote d'IvoireCroatiaCyprusCzech RepublicDenmarkDjiboutiDominicaDominican RepublicEarly-demographic dividendEast Asia & PacificEast Asia & Pacific (excluding high income)East Asia & Pacific (IDA & IBRD countries)EcuadorEgypt, Arab Rep.El SalvadorEquatorial GuineaEritreaEstoniaEthiopiaEuro areaEurope & Central AsiaEurope & Central Asia (excluding high income)Europe & Central Asia (IDA & IBRD countries)European UnionFijiFinlandFragile and conflict affected situationsFranceGabonGambia, TheGeorgiaGermanyGhanaGreeceGrenadaGuatemalaGuineaGuinea-BissauGuyanaHaitiHeavily indebted poor countries (HIPC)High incomeHondurasHong Kong SAR, ChinaHungaryIBRD onlyIcelandIDA & IBRD totalIDA blendIDA onlyIDA totalIndiaIndonesiaIran, Islamic Rep.IraqIrelandIsraelItalyJamaicaJapanJordanKazakhstanKenyaKorea, Rep.KosovoKuwaitKyrgyz RepublicLao PDRLate-demographic dividendLatin America & Caribbean Latin America & Caribbean (excluding high income)Latin America & the Caribbean (IDA & IBRD countries)LatviaLeast developed countries: UN classificationLebanonLesothoLiberiaLibyaLithuaniaLow & middle incomeLow incomeLower middle incomeLuxembourgMacao SAR, ChinaMacedonia, FYRMadagascarMalawiMalaysiaMaldivesMaliMaltaMauritaniaMauritiusMexicoMicronesia, Fed. Sts.Middle East & North AfricaMiddle East & North Africa (excluding high income)Middle East & North Africa (IDA & IBRD countries)Middle incomeMoldovaMongoliaMontenegroMoroccoMozambiqueMyanmarNamibiaNepalNetherlandsNew ZealandNicaraguaNigerNigeriaNorth AmericaNorwayOECD membersOmanOther small statesPacific island small statesPakistanPanamaPapua New GuineaParaguayPeruPhilippinesPolandPortugalPost-demographic dividendPre-demographic dividendQatarRomaniaRussian FederationRwandaSamoaSao Tome and PrincipeSaudi ArabiaSenegalSerbiaSeychellesSierra LeoneSingaporeSlovak RepublicSloveniaSmall statesSolomon IslandsSouth AfricaSouth AsiaSouth Asia (IDA & IBRD)South SudanSpainSri LankaSt. Kitts and NevisSt. LuciaSt. Vincent and the GrenadinesSub-Saharan Africa Sub-Saharan Africa (excluding high income)Sub-Saharan Africa (IDA & IBRD countries)SudanSurinameSwazilandSwedenSwitzerlandSyrian Arab RepublicTajikistanTanzaniaThailandTimor-LesteTogoTongaTrinidad and TobagoTunisiaTurkeyUgandaUkraineUnited Arab EmiratesUnited KingdomUnited StatesUpper middle incomeUruguayVanuatuVenezuela, RBVietnamWest Bank and GazaWorldYemen, Rep.ZambiaZimbabwe Timeline:
This timeline shows a graph from 1961 to 2016 of Colombia. No data until 1960. Number of actual observations by date: 54.
Source name:
World Development Indicators
Source organization:
International Monetary Fund, International Financial Statistics and data files, and World Bank and OECD GDP estimates.
Categories, topics:
Financial Sector
Last updated:
apr 23, 2017
Indicators value changes by year
Minimum:
22.881
jan 1, 1974
Maximum:
70.932
jan 1, 2015
At the date of observation
Value
Absolute change
Change from previous value
jan 1, 1961
27.096
+27.096
0.0%
jan 1, 1962
28.579
+1.483
5.47%
jan 1, 1963
31.465
+2.885
10.1%
jan 1, 1964
28.877
-2.587
-8.22%
jan 1, 1965
26.893
-1.985
-6.87%
jan 1, 1966
28.689
+1.796
6.68%
jan 1, 1967
27.588
-1.101
-3.84%
jan 1, 1968
28.863
+1.275
4.62%
jan 1, 1969
29.702
+0.839
2.91%
jan 1, 1970
31.17
+1.468
4.94%
jan 1, 1971
30.298
-0.872
-2.8%
jan 1, 1972
28.757
-1.541
-5.09%
jan 1, 1973
26.195
-2.562
-8.91%
jan 1, 1974
22.881
-3.314
-12.65%
jan 1, 1975
33.826
+10.945
47.83%
jan 1, 1976
34.057
+0.231
0.68%
jan 1, 1977
31.814
-2.243
-6.59%
jan 1, 1978
30.162
-1.651
-5.19%
jan 1, 1979
30.389
+0.226
0.75%
jan 1, 1980
27.279
-3.11
-10.23%
jan 1, 1981
30.845
+3.566
13.07%
jan 1, 1982
33.606
+2.762
8.95%
jan 1, 1983
37.045
+3.439
10.23%
jan 1, 1984
41.519
+4.474
12.08%
jan 1, 1985
45.695
+4.175
10.06%
jan 1, 1986
42.503
-3.192
-6.99%
jan 1, 1988
30.831
-11.671
-27.46%
jan 1, 1989
29.642
-1.19
-3.86%
jan 1, 1991
36.446
+6.805
22.96%
jan 1, 1992
33.421
-3.026
-8.3%
jan 1, 1993
34.672
+1.252
3.75%
jan 1, 1994
37.402
+2.73
7.87%
jan 1, 1995
34.668
-2.734
-7.31%
jan 1, 1996
37.207
+2.539
7.32%
jan 1, 1997
38.759
+1.552
4.17%
jan 1, 1998
40.805
+2.046
5.28%
jan 1, 1999
42.457
+1.651
4.05%
jan 1, 2000
41.44
-1.016
-2.39%
jan 1, 2001
30.384
-11.057
-26.68%
jan 1, 2002
38.459
+8.076
26.58%
jan 1, 2003
37.529
-0.93
-2.42%
jan 1, 2004
40.717
+3.188
8.5%
jan 1, 2005
45.234
+4.517
11.09%
jan 1, 2006
49.503
+4.269
9.44%
jan 1, 2007
51.684
+2.181
4.4%
jan 1, 2008
52.57
+0.886
1.71%
jan 1, 2009
55.477
+2.907
5.53%
jan 1, 2010
62.007
+6.531
11.77%
jan 1, 2011
65.989
+3.981
6.42%
jan 1, 2012
65.144
-0.845
-1.28%
jan 1, 2013
69.575
+4.431
6.8%
jan 1, 2014
69.819
+0.244
0.35%
jan 1, 2015
70.932
+1.113
1.59%
jan 1, 2016
52.602
-18.33
-25.84%
Ranking of countries by current statistics by years


Comments: