29
/
en
AIzaSyAYiBZKx7MnpbEhh9jyipgxe19OcubqV5w
April 1, 2024
164688
Jordan
JOR
true
2
1
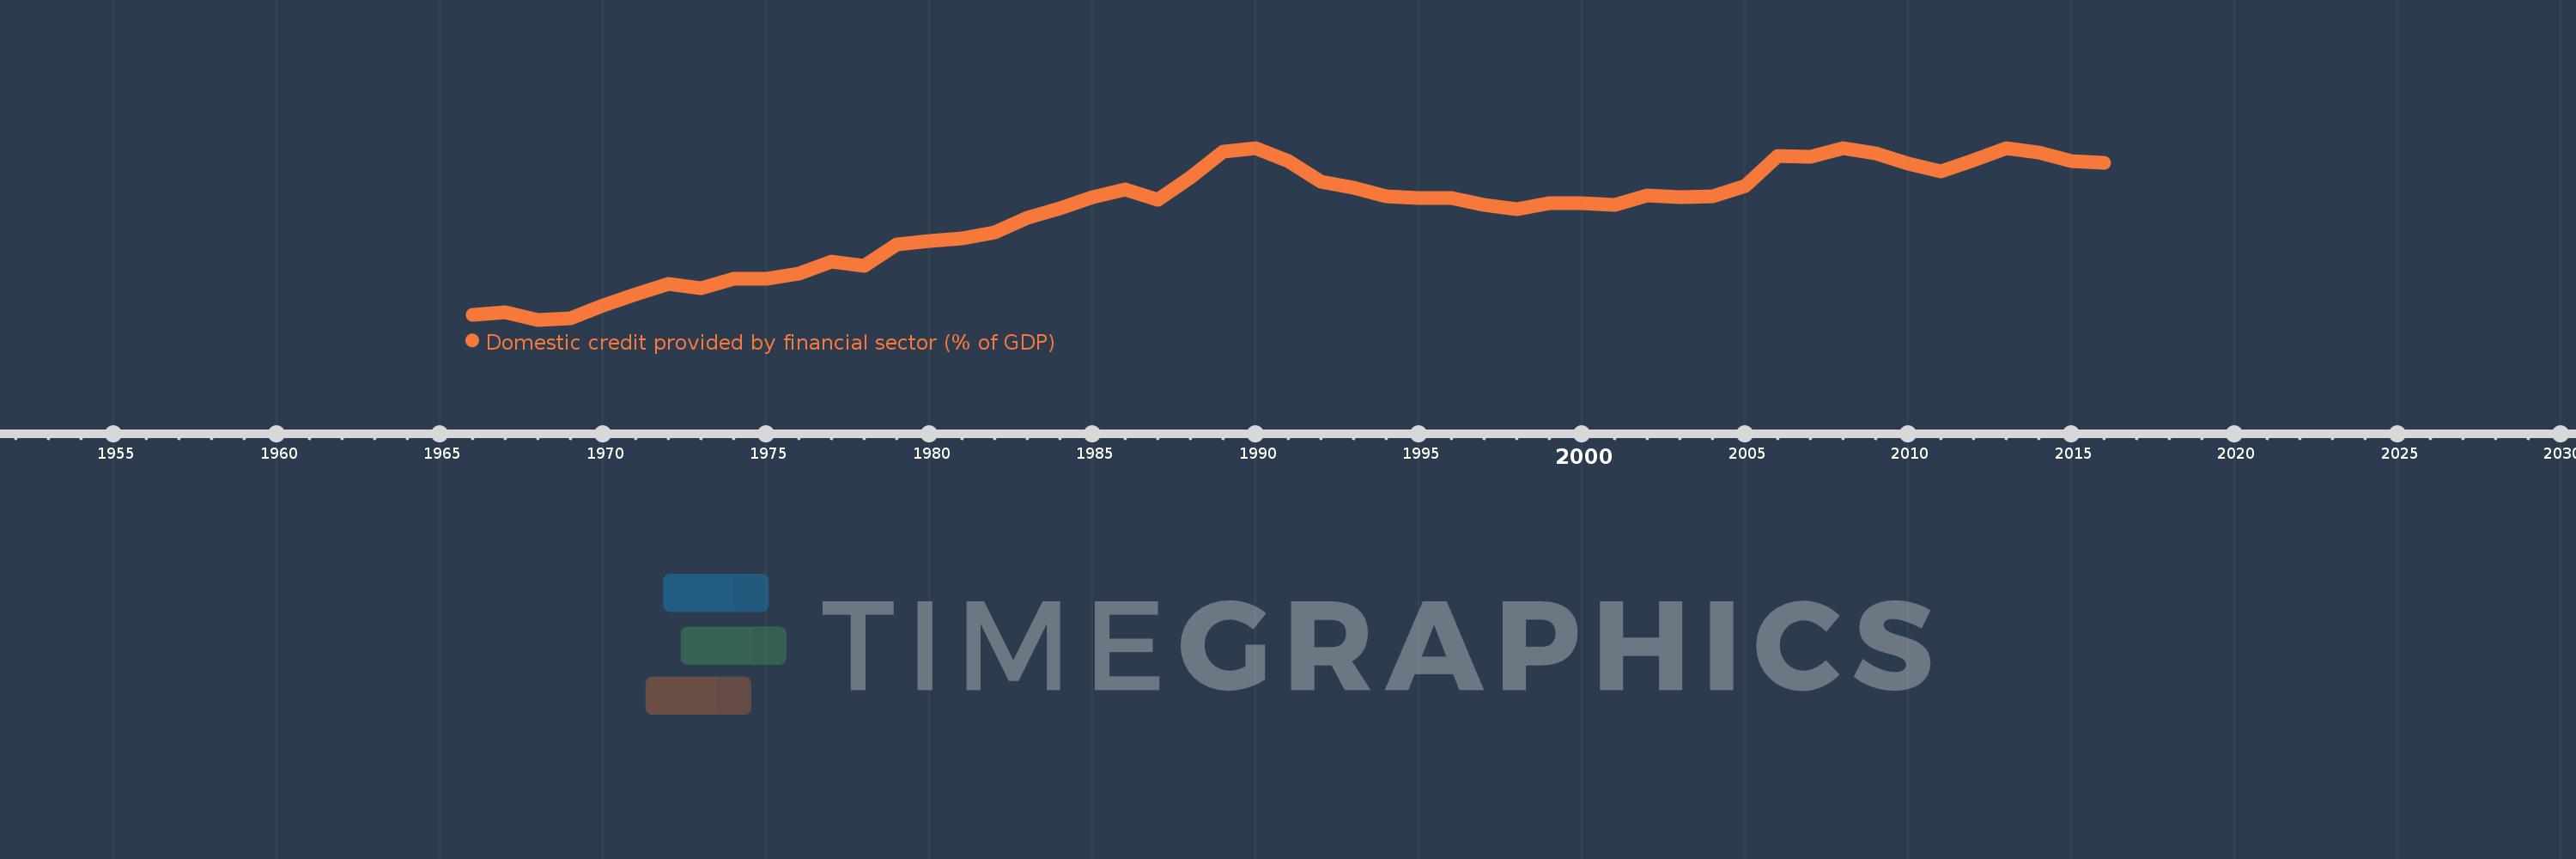
Domestic credit provided by financial sector (% of GDP)
2016,2015,2014,2013,2012,2011,2010,2009,2008,2007,2006,2005,2004,2003,2002,2001,2000,1999,1998,1997,1996,1995,1994,1993,1992,1991,1990,1989,1988,1987,1986,1985,1984,1983,1982,1981,1980,1979,1978,1977,1976,1975,1974,1973,1972,1971,1970,1969,1968,1967,1966
This statistics in other country:
AfghanistanAlbaniaAlgeriaAngolaAntigua and BarbudaArab WorldArgentinaArmeniaArubaAustraliaAustriaAzerbaijanBahamas, TheBahrainBangladeshBarbadosBelarusBelgiumBelizeBeninBhutanBoliviaBosnia and HerzegovinaBotswanaBrazilBrunei DarussalamBulgariaBurkina FasoBurundiCabo VerdeCambodiaCameroonCanadaCaribbean small statesCentral African RepublicCentral Europe and the BalticsChadChileChinaColombiaComorosCongo, Dem. Rep.Congo, Rep.Costa RicaCote d'IvoireCroatiaCyprusCzech RepublicDenmarkDjiboutiDominicaDominican RepublicEarly-demographic dividendEast Asia & PacificEast Asia & Pacific (excluding high income)East Asia & Pacific (IDA & IBRD countries)EcuadorEgypt, Arab Rep.El SalvadorEquatorial GuineaEritreaEstoniaEthiopiaEuro areaEurope & Central AsiaEurope & Central Asia (excluding high income)Europe & Central Asia (IDA & IBRD countries)European UnionFijiFinlandFragile and conflict affected situationsFranceGabonGambia, TheGeorgiaGermanyGhanaGreeceGrenadaGuatemalaGuineaGuinea-BissauGuyanaHaitiHeavily indebted poor countries (HIPC)High incomeHondurasHong Kong SAR, ChinaHungaryIBRD onlyIcelandIDA & IBRD totalIDA blendIDA onlyIDA totalIndiaIndonesiaIran, Islamic Rep.IraqIrelandIsraelItalyJamaicaJapanJordanKazakhstanKenyaKorea, Rep.KosovoKuwaitKyrgyz RepublicLao PDRLate-demographic dividendLatin America & Caribbean Latin America & Caribbean (excluding high income)Latin America & the Caribbean (IDA & IBRD countries)LatviaLeast developed countries: UN classificationLebanonLesothoLiberiaLibyaLithuaniaLow & middle incomeLow incomeLower middle incomeLuxembourgMacao SAR, ChinaMacedonia, FYRMadagascarMalawiMalaysiaMaldivesMaliMaltaMauritaniaMauritiusMexicoMicronesia, Fed. Sts.Middle East & North AfricaMiddle East & North Africa (excluding high income)Middle East & North Africa (IDA & IBRD countries)Middle incomeMoldovaMongoliaMontenegroMoroccoMozambiqueMyanmarNamibiaNepalNetherlandsNew ZealandNicaraguaNigerNigeriaNorth AmericaNorwayOECD membersOmanOther small statesPacific island small statesPakistanPanamaPapua New GuineaParaguayPeruPhilippinesPolandPortugalPost-demographic dividendPre-demographic dividendQatarRomaniaRussian FederationRwandaSamoaSao Tome and PrincipeSaudi ArabiaSenegalSerbiaSeychellesSierra LeoneSingaporeSlovak RepublicSloveniaSmall statesSolomon IslandsSouth AfricaSouth AsiaSouth Asia (IDA & IBRD)South SudanSpainSri LankaSt. Kitts and NevisSt. LuciaSt. Vincent and the GrenadinesSub-Saharan Africa Sub-Saharan Africa (excluding high income)Sub-Saharan Africa (IDA & IBRD countries)SudanSurinameSwazilandSwedenSwitzerlandSyrian Arab RepublicTajikistanTanzaniaThailandTimor-LesteTogoTongaTrinidad and TobagoTunisiaTurkeyUgandaUkraineUnited Arab EmiratesUnited KingdomUnited StatesUpper middle incomeUruguayVanuatuVenezuela, RBVietnamWest Bank and GazaWorldYemen, Rep.ZambiaZimbabwe Timeline:
This timeline shows a graph from 1966 to 2016 of Jordan. No data until 1965. Number of actual observations by date: 51.
Source name:
World Development Indicators
Source organization:
International Monetary Fund, International Financial Statistics and data files, and World Bank and OECD GDP estimates.
Categories, topics:
Financial Sector
Last updated:
apr 23, 2017
Indicators value changes by year
Maximum:
114.651
jan 1, 1990
At the date of observation
Value
Absolute change
Change from previous value
jan 1, 1966
8.841
+8.841
0.0%
jan 1, 1967
10.487
+1.646
18.62%
jan 1, 1968
5.571
-4.916
-46.87%
jan 1, 1969
6.671
+1.1
19.74%
jan 1, 1970
14.472
+7.801
116.93%
jan 1, 1971
21.633
+7.161
49.48%
jan 1, 1972
28.224
+6.591
30.47%
jan 1, 1973
25.358
-2.866
-10.15%
jan 1, 1974
31.625
+6.267
24.71%
jan 1, 1975
31.642
+0.017
0.05%
jan 1, 1976
35.009
+3.367
10.64%
jan 1, 1977
42.296
+7.287
20.81%
jan 1, 1978
39.923
-2.373
-5.61%
jan 1, 1979
53.451
+13.528
33.88%
jan 1, 1980
55.566
+2.115
3.96%
jan 1, 1981
57.244
+1.678
3.02%
jan 1, 1982
61.021
+3.777
6.6%
jan 1, 1983
70.436
+9.415
15.43%
jan 1, 1984
76.148
+5.712
8.11%
jan 1, 1985
83.147
+6.999
9.19%
jan 1, 1986
88.468
+5.321
6.4%
jan 1, 1987
81.866
-6.601
-7.46%
jan 1, 1988
95.85
+13.984
17.08%
jan 1, 1989
112.245
+16.395
17.1%
jan 1, 1990
114.651
+2.406
2.14%
jan 1, 1991
106.306
-8.345
-7.28%
jan 1, 1992
93.275
-13.031
-12.26%
jan 1, 1993
89.205
-4.07
-4.36%
jan 1, 1994
84.074
-5.131
-5.75%
jan 1, 1995
82.956
-1.117
-1.33%
jan 1, 1996
82.849
-0.108
-0.13%
jan 1, 1997
78.74
-4.108
-4.96%
jan 1, 1998
75.825
-2.915
-3.7%
jan 1, 1999
79.632
+3.807
5.02%
jan 1, 2000
79.379
-0.253
-0.32%
jan 1, 2001
78.76
-0.619
-0.78%
jan 1, 2002
84.328
+5.568
7.07%
jan 1, 2003
83.497
-0.831
-0.99%
jan 1, 2004
83.975
+0.478
0.57%
jan 1, 2005
90.741
+6.766
8.06%
jan 1, 2006
109.744
+19.002
20.94%
jan 1, 2007
109.073
-0.671
-0.61%
jan 1, 2008
114.319
+5.246
4.81%
jan 1, 2009
110.97
-3.349
-2.93%
jan 1, 2010
104.621
-6.349
-5.72%
jan 1, 2011
99.923
-4.697
-4.49%
jan 1, 2012
106.671
+6.748
6.75%
jan 1, 2013
114.247
+7.576
7.1%
jan 1, 2014
111.86
-2.386
-2.09%
jan 1, 2015
106.177
-5.683
-5.08%
jan 1, 2016
105.477
-0.7
-0.66%
Ranking of countries by current statistics by years


Comments: