29
/
en
AIzaSyAYiBZKx7MnpbEhh9jyipgxe19OcubqV5w
April 1, 2024
251792
St. Vincent and the Grenadines
VCT
true
2
1
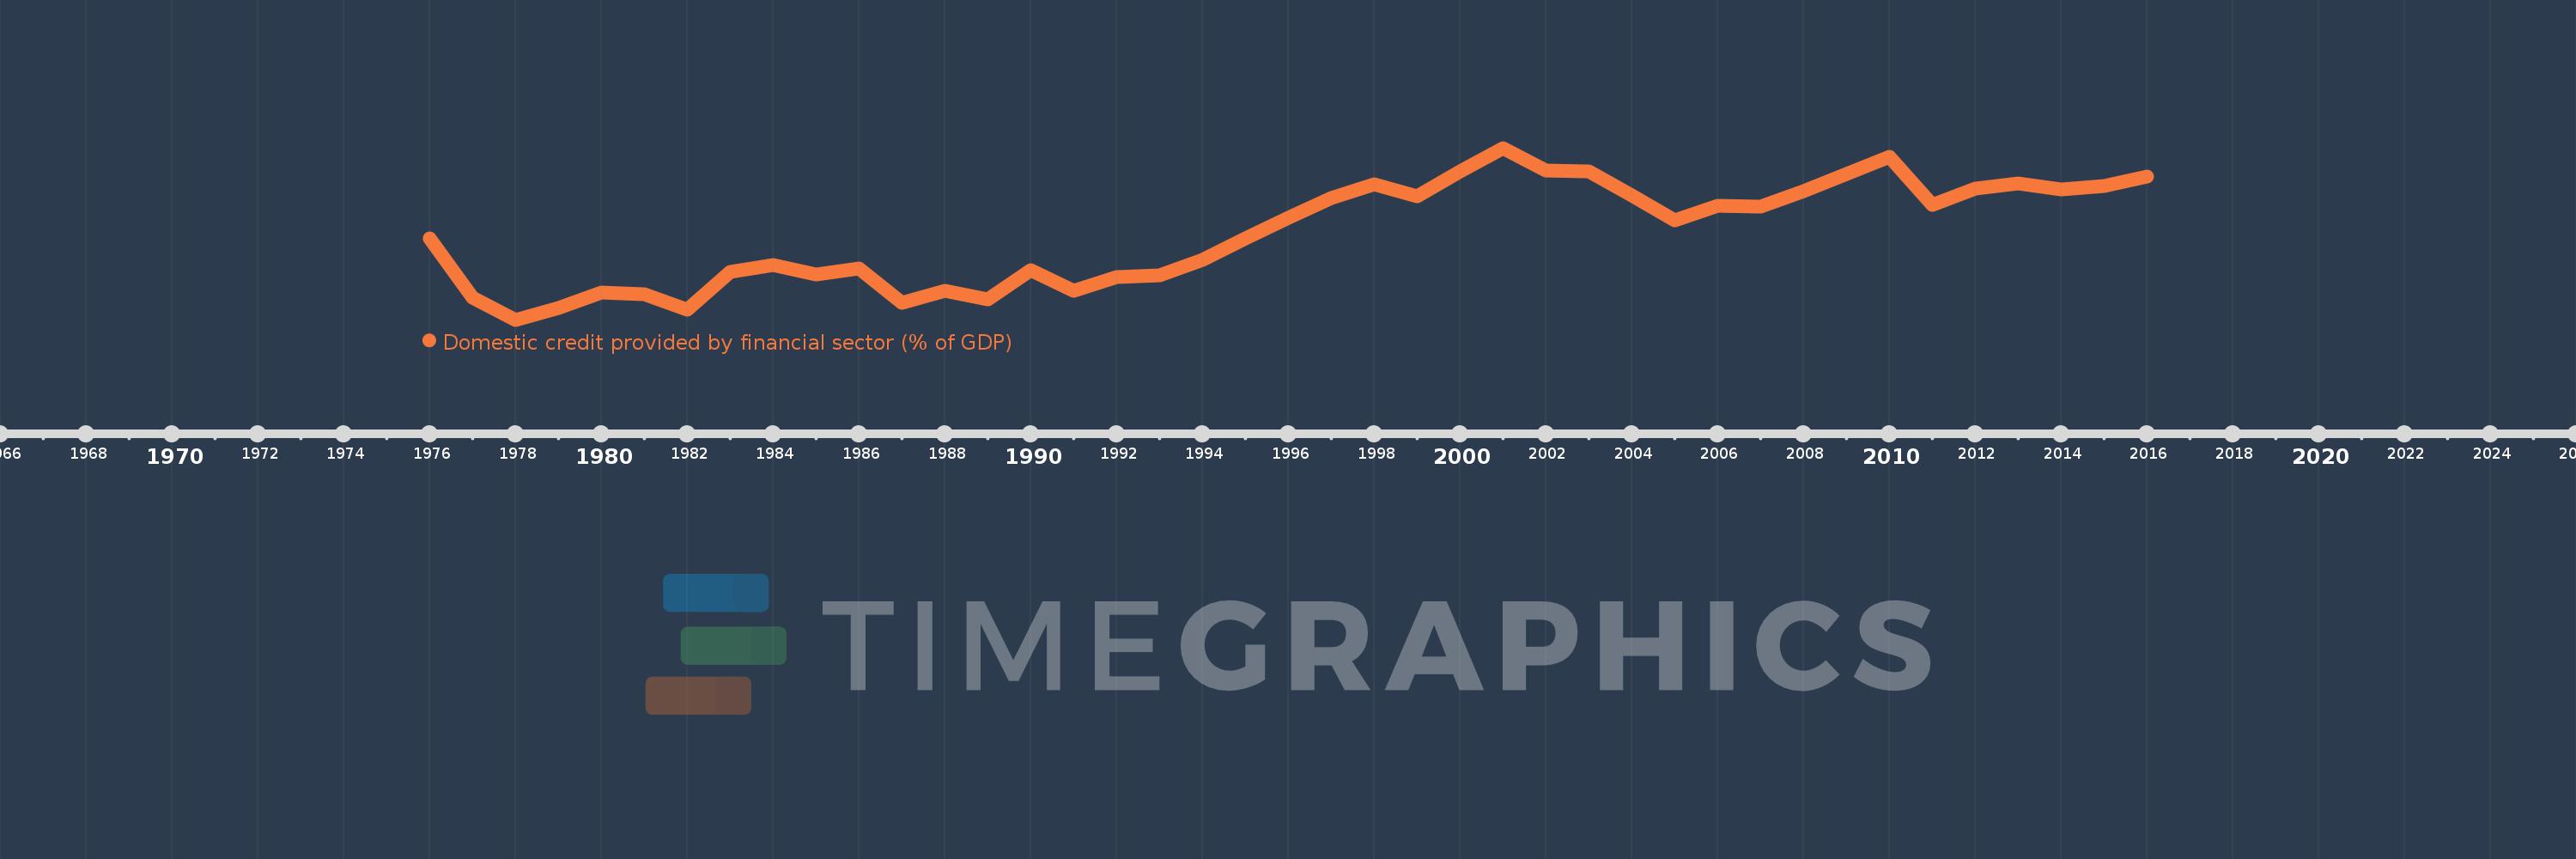
Domestic credit provided by financial sector (% of GDP)
2016,2015,2014,2013,2012,2011,2010,2009,2008,2007,2006,2005,2004,2003,2002,2001,2000,1999,1998,1997,1996,1995,1994,1993,1992,1991,1990,1989,1988,1987,1986,1985,1984,1983,1982,1981,1980,1979,1978,1977,1976
This statistics in other country:
AfghanistanAlbaniaAlgeriaAngolaAntigua and BarbudaArab WorldArgentinaArmeniaArubaAustraliaAustriaAzerbaijanBahamas, TheBahrainBangladeshBarbadosBelarusBelgiumBelizeBeninBhutanBoliviaBosnia and HerzegovinaBotswanaBrazilBrunei DarussalamBulgariaBurkina FasoBurundiCabo VerdeCambodiaCameroonCanadaCaribbean small statesCentral African RepublicCentral Europe and the BalticsChadChileChinaColombiaComorosCongo, Dem. Rep.Congo, Rep.Costa RicaCote d'IvoireCroatiaCyprusCzech RepublicDenmarkDjiboutiDominicaDominican RepublicEarly-demographic dividendEast Asia & PacificEast Asia & Pacific (excluding high income)East Asia & Pacific (IDA & IBRD countries)EcuadorEgypt, Arab Rep.El SalvadorEquatorial GuineaEritreaEstoniaEthiopiaEuro areaEurope & Central AsiaEurope & Central Asia (excluding high income)Europe & Central Asia (IDA & IBRD countries)European UnionFijiFinlandFragile and conflict affected situationsFranceGabonGambia, TheGeorgiaGermanyGhanaGreeceGrenadaGuatemalaGuineaGuinea-BissauGuyanaHaitiHeavily indebted poor countries (HIPC)High incomeHondurasHong Kong SAR, ChinaHungaryIBRD onlyIcelandIDA & IBRD totalIDA blendIDA onlyIDA totalIndiaIndonesiaIran, Islamic Rep.IraqIrelandIsraelItalyJamaicaJapanJordanKazakhstanKenyaKorea, Rep.KosovoKuwaitKyrgyz RepublicLao PDRLate-demographic dividendLatin America & Caribbean Latin America & Caribbean (excluding high income)Latin America & the Caribbean (IDA & IBRD countries)LatviaLeast developed countries: UN classificationLebanonLesothoLiberiaLibyaLithuaniaLow & middle incomeLow incomeLower middle incomeLuxembourgMacao SAR, ChinaMacedonia, FYRMadagascarMalawiMalaysiaMaldivesMaliMaltaMauritaniaMauritiusMexicoMicronesia, Fed. Sts.Middle East & North AfricaMiddle East & North Africa (excluding high income)Middle East & North Africa (IDA & IBRD countries)Middle incomeMoldovaMongoliaMontenegroMoroccoMozambiqueMyanmarNamibiaNepalNetherlandsNew ZealandNicaraguaNigerNigeriaNorth AmericaNorwayOECD membersOmanOther small statesPacific island small statesPakistanPanamaPapua New GuineaParaguayPeruPhilippinesPolandPortugalPost-demographic dividendPre-demographic dividendQatarRomaniaRussian FederationRwandaSamoaSao Tome and PrincipeSaudi ArabiaSenegalSerbiaSeychellesSierra LeoneSingaporeSlovak RepublicSloveniaSmall statesSolomon IslandsSouth AfricaSouth AsiaSouth Asia (IDA & IBRD)South SudanSpainSri LankaSt. Kitts and NevisSt. LuciaSt. Vincent and the GrenadinesSub-Saharan Africa Sub-Saharan Africa (excluding high income)Sub-Saharan Africa (IDA & IBRD countries)SudanSurinameSwazilandSwedenSwitzerlandSyrian Arab RepublicTajikistanTanzaniaThailandTimor-LesteTogoTongaTrinidad and TobagoTunisiaTurkeyUgandaUkraineUnited Arab EmiratesUnited KingdomUnited StatesUpper middle incomeUruguayVanuatuVenezuela, RBVietnamWest Bank and GazaWorldYemen, Rep.ZambiaZimbabwe Timeline:
This timeline shows a graph from 1976 to 2016 of St. Vincent and the Grenadines. No data until 1975. Number of actual observations by date: 41.
Source name:
World Development Indicators
Source organization:
International Monetary Fund, International Financial Statistics and data files, and World Bank and OECD GDP estimates.
Categories, topics:
Financial Sector
Last updated:
apr 23, 2017
Indicators value changes by year
Minimum:
35.963
jan 1, 1978
Maximum:
64.242
jan 1, 2001
At the date of observation
Value
Absolute change
Change from previous value
jan 1, 1976
49.357
+49.357
0.0%
jan 1, 1977
39.601
-9.755
-19.77%
jan 1, 1978
35.963
-3.638
-9.19%
jan 1, 1979
37.83
+1.867
5.19%
jan 1, 1980
40.425
+2.595
6.86%
jan 1, 1981
40.156
-0.269
-0.67%
jan 1, 1982
37.631
-2.524
-6.29%
jan 1, 1983
43.769
+6.137
16.31%
jan 1, 1984
44.904
+1.135
2.59%
jan 1, 1985
43.426
-1.478
-3.29%
jan 1, 1986
44.416
+0.99
2.28%
jan 1, 1987
38.753
-5.663
-12.75%
jan 1, 1988
40.714
+1.961
5.06%
jan 1, 1989
39.308
-1.406
-3.45%
jan 1, 1990
44.156
+4.849
12.34%
jan 1, 1991
40.743
-3.413
-7.73%
jan 1, 1992
42.995
+2.252
5.53%
jan 1, 1993
43.241
+0.247
0.57%
jan 1, 1994
45.865
+2.624
6.07%
jan 1, 1995
49.319
+3.453
7.53%
jan 1, 1996
52.713
+3.395
6.88%
jan 1, 1997
56.003
+3.289
6.24%
jan 1, 1998
58.33
+2.328
4.16%
jan 1, 1999
56.232
-2.098
-3.6%
jan 1, 2000
60.346
+4.113
7.31%
jan 1, 2001
64.242
+3.897
6.46%
jan 1, 2002
60.542
-3.7
-5.76%
jan 1, 2003
60.39
-0.152
-0.25%
jan 1, 2004
56.459
-3.931
-6.51%
jan 1, 2005
52.261
-4.198
-7.44%
jan 1, 2006
54.731
+2.47
4.73%
jan 1, 2007
54.633
-0.098
-0.18%
jan 1, 2008
57.166
+2.534
4.64%
jan 1, 2009
60.026
+2.86
5.0%
jan 1, 2010
62.742
+2.715
4.52%
jan 1, 2011
54.908
-7.834
-12.49%
jan 1, 2012
57.577
+2.669
4.86%
jan 1, 2013
58.423
+0.846
1.47%
jan 1, 2014
57.469
-0.954
-1.63%
jan 1, 2015
57.974
+0.504
0.88%
jan 1, 2016
59.505
+1.531
2.64%
Ranking of countries by current statistics by years


Comments: