29
/
en
AIzaSyAYiBZKx7MnpbEhh9jyipgxe19OcubqV5w
April 1, 2024
153414
Iceland
ISL
true
2
1
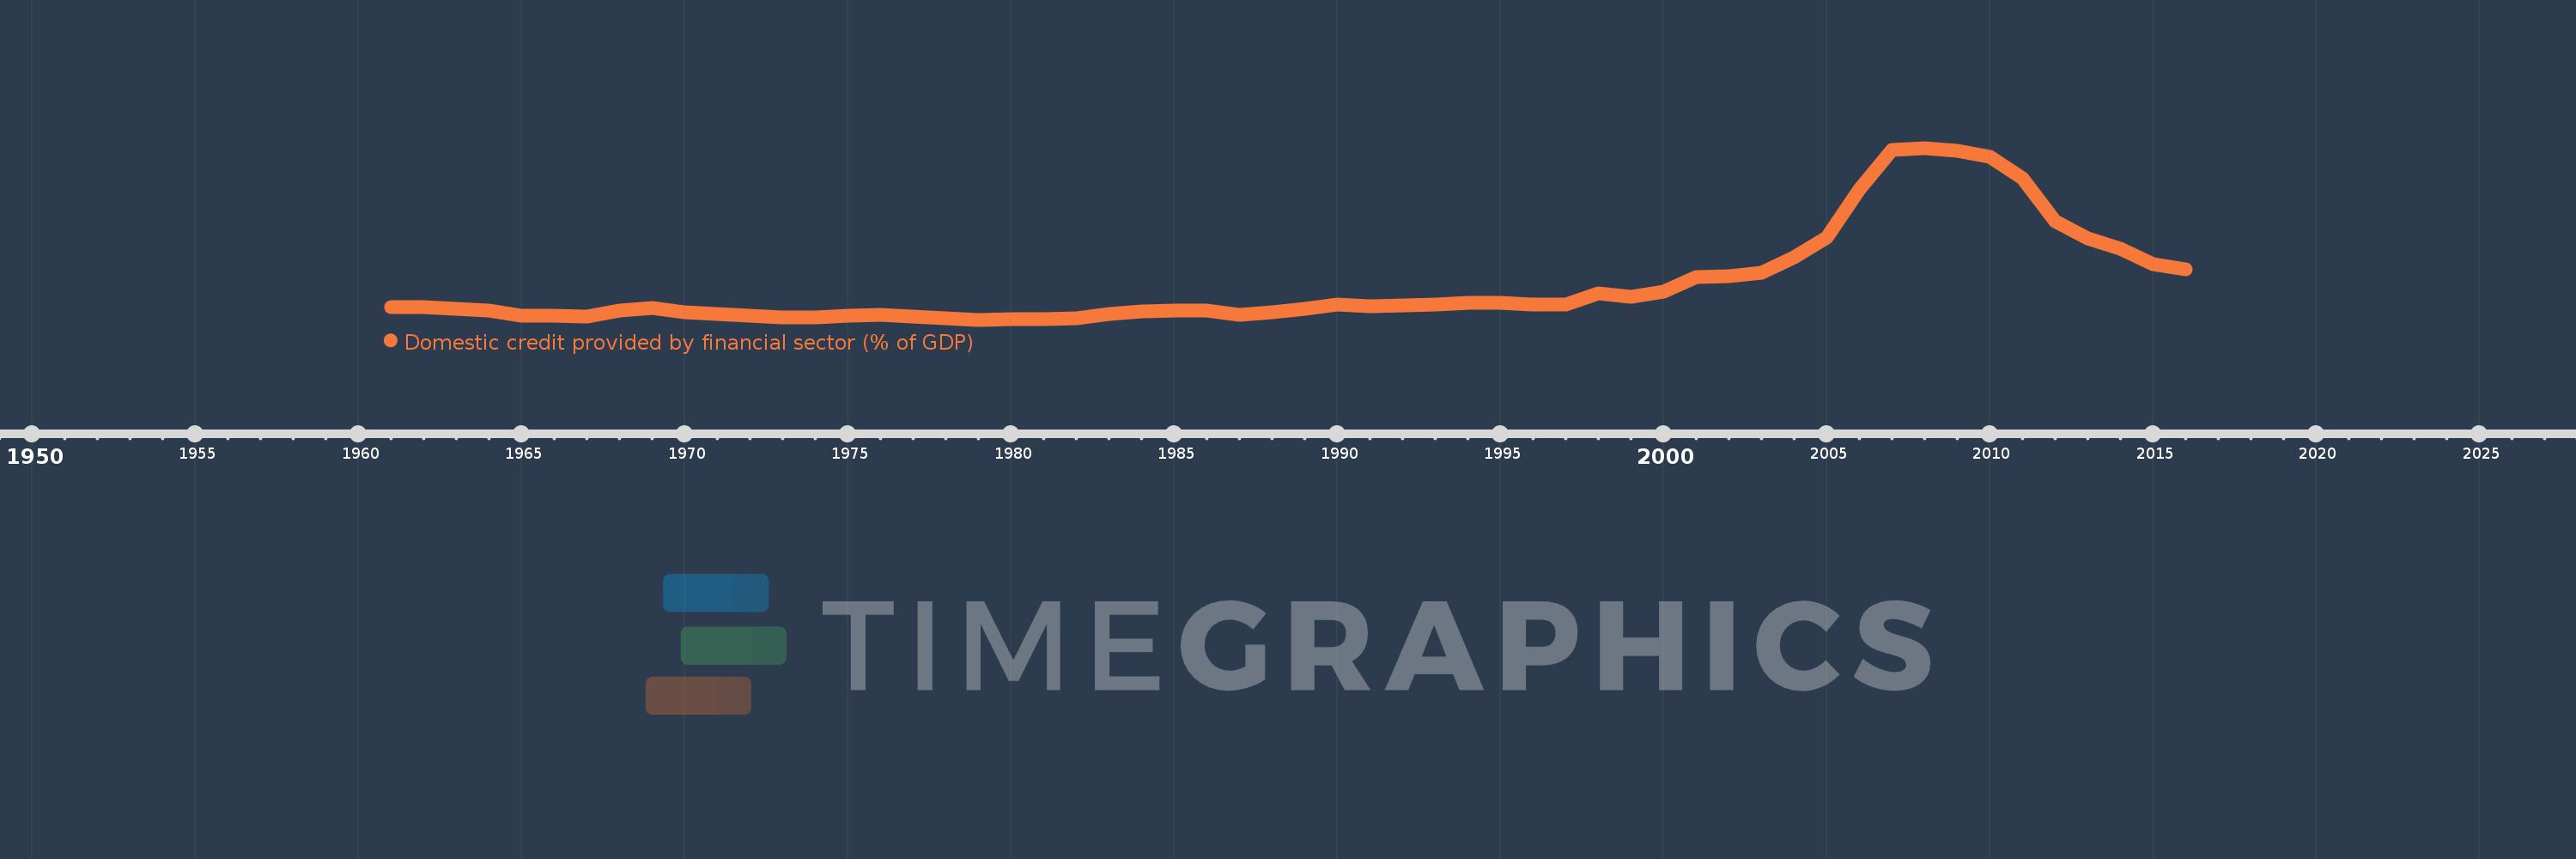
Domestic credit provided by financial sector (% of GDP)
2016,2015,2014,2013,2012,2011,2010,2009,2008,2007,2006,2005,2004,2003,2002,2001,2000,1999,1998,1997,1996,1995,1994,1993,1992,1991,1990,1989,1988,1987,1986,1985,1984,1983,1982,1981,1980,1979,1978,1977,1976,1975,1974,1973,1972,1971,1970,1969,1968,1967,1966,1965,1964,1963,1962,1961
This statistics in other country:
AfghanistanAlbaniaAlgeriaAngolaAntigua and BarbudaArab WorldArgentinaArmeniaArubaAustraliaAustriaAzerbaijanBahamas, TheBahrainBangladeshBarbadosBelarusBelgiumBelizeBeninBhutanBoliviaBosnia and HerzegovinaBotswanaBrazilBrunei DarussalamBulgariaBurkina FasoBurundiCabo VerdeCambodiaCameroonCanadaCaribbean small statesCentral African RepublicCentral Europe and the BalticsChadChileChinaColombiaComorosCongo, Dem. Rep.Congo, Rep.Costa RicaCote d'IvoireCroatiaCyprusCzech RepublicDenmarkDjiboutiDominicaDominican RepublicEarly-demographic dividendEast Asia & PacificEast Asia & Pacific (excluding high income)East Asia & Pacific (IDA & IBRD countries)EcuadorEgypt, Arab Rep.El SalvadorEquatorial GuineaEritreaEstoniaEthiopiaEuro areaEurope & Central AsiaEurope & Central Asia (excluding high income)Europe & Central Asia (IDA & IBRD countries)European UnionFijiFinlandFragile and conflict affected situationsFranceGabonGambia, TheGeorgiaGermanyGhanaGreeceGrenadaGuatemalaGuineaGuinea-BissauGuyanaHaitiHeavily indebted poor countries (HIPC)High incomeHondurasHong Kong SAR, ChinaHungaryIBRD onlyIcelandIDA & IBRD totalIDA blendIDA onlyIDA totalIndiaIndonesiaIran, Islamic Rep.IraqIrelandIsraelItalyJamaicaJapanJordanKazakhstanKenyaKorea, Rep.KosovoKuwaitKyrgyz RepublicLao PDRLate-demographic dividendLatin America & Caribbean Latin America & Caribbean (excluding high income)Latin America & the Caribbean (IDA & IBRD countries)LatviaLeast developed countries: UN classificationLebanonLesothoLiberiaLibyaLithuaniaLow & middle incomeLow incomeLower middle incomeLuxembourgMacao SAR, ChinaMacedonia, FYRMadagascarMalawiMalaysiaMaldivesMaliMaltaMauritaniaMauritiusMexicoMicronesia, Fed. Sts.Middle East & North AfricaMiddle East & North Africa (excluding high income)Middle East & North Africa (IDA & IBRD countries)Middle incomeMoldovaMongoliaMontenegroMoroccoMozambiqueMyanmarNamibiaNepalNetherlandsNew ZealandNicaraguaNigerNigeriaNorth AmericaNorwayOECD membersOmanOther small statesPacific island small statesPakistanPanamaPapua New GuineaParaguayPeruPhilippinesPolandPortugalPost-demographic dividendPre-demographic dividendQatarRomaniaRussian FederationRwandaSamoaSao Tome and PrincipeSaudi ArabiaSenegalSerbiaSeychellesSierra LeoneSingaporeSlovak RepublicSloveniaSmall statesSolomon IslandsSouth AfricaSouth AsiaSouth Asia (IDA & IBRD)South SudanSpainSri LankaSt. Kitts and NevisSt. LuciaSt. Vincent and the GrenadinesSub-Saharan Africa Sub-Saharan Africa (excluding high income)Sub-Saharan Africa (IDA & IBRD countries)SudanSurinameSwazilandSwedenSwitzerlandSyrian Arab RepublicTajikistanTanzaniaThailandTimor-LesteTogoTongaTrinidad and TobagoTunisiaTurkeyUgandaUkraineUnited Arab EmiratesUnited KingdomUnited StatesUpper middle incomeUruguayVanuatuVenezuela, RBVietnamWest Bank and GazaWorldYemen, Rep.ZambiaZimbabwe Timeline:
This timeline shows a graph from 1961 to 2016 of Iceland. No data until 1960. Number of actual observations by date: 56.
Source name:
World Development Indicators
Source organization:
International Monetary Fund, International Financial Statistics and data files, and World Bank and OECD GDP estimates.
Categories, topics:
Financial Sector
Last updated:
apr 23, 2017
Indicators value changes by year
Minimum:
27.219
jan 1, 1979
Maximum:
301.187
jan 1, 2008
At the date of observation
Value
Absolute change
Change from previous value
jan 1, 1961
47.17
+47.17
0.0%
jan 1, 1962
47.708
+0.538
1.14%
jan 1, 1963
44.762
-2.945
-6.17%
jan 1, 1964
41.805
-2.957
-6.61%
jan 1, 1965
33.315
-8.49
-20.31%
jan 1, 1966
33.796
+0.481
1.44%
jan 1, 1967
31.747
-2.049
-6.06%
jan 1, 1968
41.242
+9.495
29.91%
jan 1, 1969
45.679
+4.437
10.76%
jan 1, 1970
39.629
-6.051
-13.25%
jan 1, 1971
36.056
-3.573
-9.02%
jan 1, 1972
33.34
-2.715
-7.53%
jan 1, 1973
31.238
-2.102
-6.31%
jan 1, 1974
30.654
-0.584
-1.87%
jan 1, 1975
34.059
+3.405
11.11%
jan 1, 1976
35.641
+1.582
4.65%
jan 1, 1977
31.676
-3.965
-11.13%
jan 1, 1978
29.309
-2.366
-7.47%
jan 1, 1979
27.219
-2.09
-7.13%
jan 1, 1980
27.552
+0.333
1.22%
jan 1, 1981
28.188
+0.636
2.31%
jan 1, 1982
29.996
+1.808
6.41%
jan 1, 1983
36.592
+6.596
21.99%
jan 1, 1984
39.903
+3.311
9.05%
jan 1, 1985
41.987
+2.084
5.22%
jan 1, 1986
41.646
-0.342
-0.81%
jan 1, 1987
35.711
-5.935
-14.25%
jan 1, 1988
39.169
+3.458
9.68%
jan 1, 1989
44.717
+5.548
14.17%
jan 1, 1990
51.592
+6.874
15.37%
jan 1, 1991
48.246
-3.346
-6.49%
jan 1, 1992
49.64
+1.394
2.89%
jan 1, 1993
51.986
+2.346
4.73%
jan 1, 1994
54.536
+2.549
4.9%
jan 1, 1995
53.698
-0.838
-1.54%
jan 1, 1996
51.282
-2.416
-4.5%
jan 1, 1997
51.865
+0.583
1.14%
jan 1, 1998
68.914
+17.049
32.87%
jan 1, 1999
63.677
-5.237
-7.6%
jan 1, 2000
72.374
+8.697
13.66%
jan 1, 2001
95.681
+23.307
32.2%
jan 1, 2002
97.25
+1.569
1.64%
jan 1, 2003
101.852
+4.602
4.73%
jan 1, 2004
126.521
+24.669
24.22%
jan 1, 2005
158.758
+32.237
25.48%
jan 1, 2006
235.708
+76.95
48.47%
jan 1, 2007
297.589
+61.88
26.25%
jan 1, 2008
301.187
+3.599
1.21%
jan 1, 2009
297.005
-4.182
-1.39%
jan 1, 2010
286.595
-10.409
-3.5%
jan 1, 2011
252.521
-34.075
-11.89%
jan 1, 2012
184.732
-67.788
-26.84%
jan 1, 2013
156.377
-28.355
-15.35%
jan 1, 2014
140.947
-15.43
-9.87%
jan 1, 2015
116.06
-24.887
-17.66%
jan 1, 2016
108.002
-8.059
-6.94%
Ranking of countries by current statistics by years


Comments: