29
/
en
AIzaSyAYiBZKx7MnpbEhh9jyipgxe19OcubqV5w
April 1, 2024
104725
Chile
CHL
true
2
1
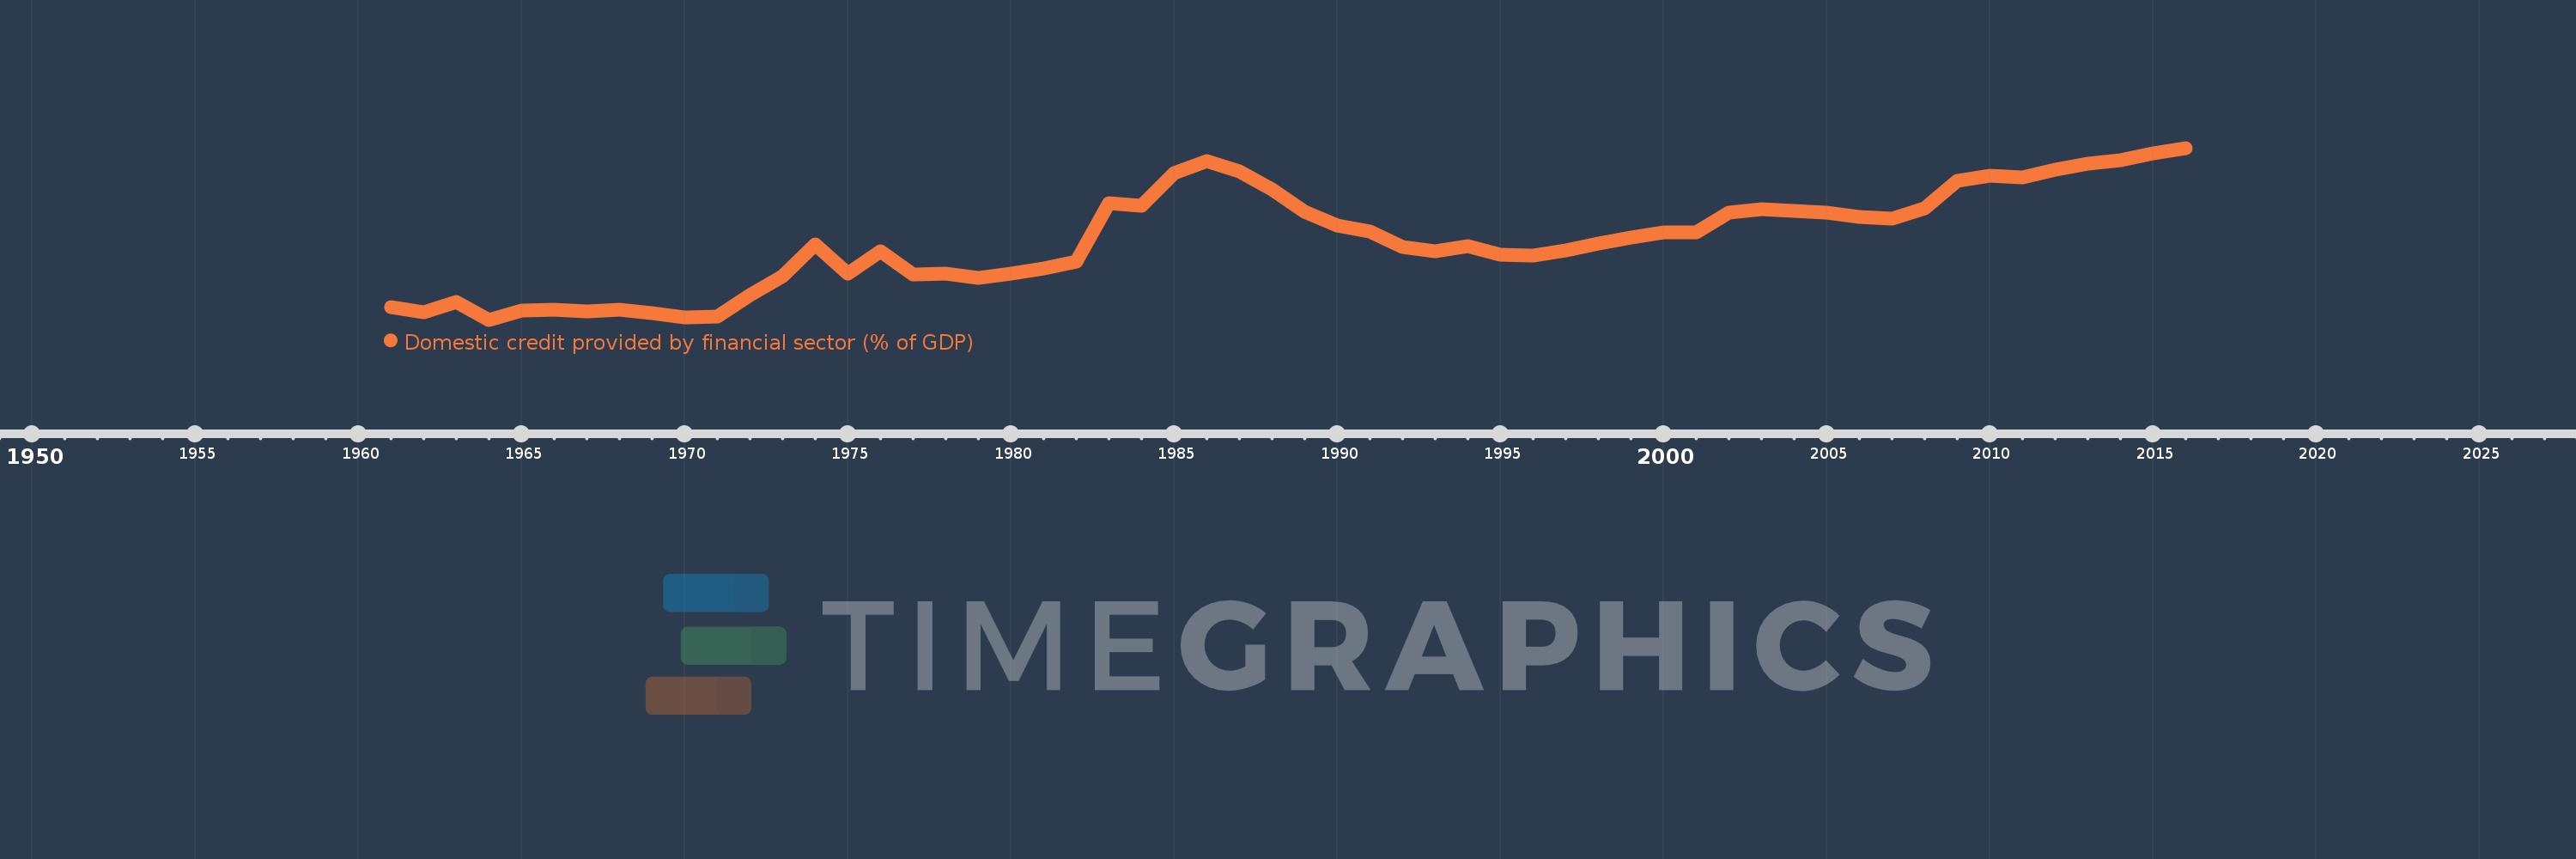
Domestic credit provided by financial sector (% of GDP)
2016,2015,2014,2013,2012,2011,2010,2009,2008,2007,2006,2005,2004,2003,2002,2001,2000,1999,1998,1997,1996,1995,1994,1993,1992,1991,1990,1989,1988,1987,1986,1985,1984,1983,1982,1981,1980,1979,1978,1977,1976,1975,1974,1973,1972,1971,1970,1969,1968,1967,1966,1965,1964,1963,1962,1961
This statistics in other country:
AfghanistanAlbaniaAlgeriaAngolaAntigua and BarbudaArab WorldArgentinaArmeniaArubaAustraliaAustriaAzerbaijanBahamas, TheBahrainBangladeshBarbadosBelarusBelgiumBelizeBeninBhutanBoliviaBosnia and HerzegovinaBotswanaBrazilBrunei DarussalamBulgariaBurkina FasoBurundiCabo VerdeCambodiaCameroonCanadaCaribbean small statesCentral African RepublicCentral Europe and the BalticsChadChileChinaColombiaComorosCongo, Dem. Rep.Congo, Rep.Costa RicaCote d'IvoireCroatiaCyprusCzech RepublicDenmarkDjiboutiDominicaDominican RepublicEarly-demographic dividendEast Asia & PacificEast Asia & Pacific (excluding high income)East Asia & Pacific (IDA & IBRD countries)EcuadorEgypt, Arab Rep.El SalvadorEquatorial GuineaEritreaEstoniaEthiopiaEuro areaEurope & Central AsiaEurope & Central Asia (excluding high income)Europe & Central Asia (IDA & IBRD countries)European UnionFijiFinlandFragile and conflict affected situationsFranceGabonGambia, TheGeorgiaGermanyGhanaGreeceGrenadaGuatemalaGuineaGuinea-BissauGuyanaHaitiHeavily indebted poor countries (HIPC)High incomeHondurasHong Kong SAR, ChinaHungaryIBRD onlyIcelandIDA & IBRD totalIDA blendIDA onlyIDA totalIndiaIndonesiaIran, Islamic Rep.IraqIrelandIsraelItalyJamaicaJapanJordanKazakhstanKenyaKorea, Rep.KosovoKuwaitKyrgyz RepublicLao PDRLate-demographic dividendLatin America & Caribbean Latin America & Caribbean (excluding high income)Latin America & the Caribbean (IDA & IBRD countries)LatviaLeast developed countries: UN classificationLebanonLesothoLiberiaLibyaLithuaniaLow & middle incomeLow incomeLower middle incomeLuxembourgMacao SAR, ChinaMacedonia, FYRMadagascarMalawiMalaysiaMaldivesMaliMaltaMauritaniaMauritiusMexicoMicronesia, Fed. Sts.Middle East & North AfricaMiddle East & North Africa (excluding high income)Middle East & North Africa (IDA & IBRD countries)Middle incomeMoldovaMongoliaMontenegroMoroccoMozambiqueMyanmarNamibiaNepalNetherlandsNew ZealandNicaraguaNigerNigeriaNorth AmericaNorwayOECD membersOmanOther small statesPacific island small statesPakistanPanamaPapua New GuineaParaguayPeruPhilippinesPolandPortugalPost-demographic dividendPre-demographic dividendQatarRomaniaRussian FederationRwandaSamoaSao Tome and PrincipeSaudi ArabiaSenegalSerbiaSeychellesSierra LeoneSingaporeSlovak RepublicSloveniaSmall statesSolomon IslandsSouth AfricaSouth AsiaSouth Asia (IDA & IBRD)South SudanSpainSri LankaSt. Kitts and NevisSt. LuciaSt. Vincent and the GrenadinesSub-Saharan Africa Sub-Saharan Africa (excluding high income)Sub-Saharan Africa (IDA & IBRD countries)SudanSurinameSwazilandSwedenSwitzerlandSyrian Arab RepublicTajikistanTanzaniaThailandTimor-LesteTogoTongaTrinidad and TobagoTunisiaTurkeyUgandaUkraineUnited Arab EmiratesUnited KingdomUnited StatesUpper middle incomeUruguayVanuatuVenezuela, RBVietnamWest Bank and GazaWorldYemen, Rep.ZambiaZimbabwe Timeline:
This timeline shows a graph from 1961 to 2016 of Chile. No data until 1960. Number of actual observations by date: 56.
Source name:
World Development Indicators
Source organization:
International Monetary Fund, International Financial Statistics and data files, and World Bank and OECD GDP estimates.
Categories, topics:
Financial Sector
Last updated:
apr 23, 2017
Indicators value changes by year
Minimum:
14.517
jan 1, 1964
Maximum:
123.263
jan 1, 2016
At the date of observation
Value
Absolute change
Change from previous value
jan 1, 1961
22.443
+22.443
0.0%
jan 1, 1962
19.146
-3.297
-14.69%
jan 1, 1963
25.717
+6.571
34.32%
jan 1, 1964
14.517
-11.2
-43.55%
jan 1, 1965
20.361
+5.844
40.26%
jan 1, 1966
20.916
+0.555
2.72%
jan 1, 1967
19.73
-1.186
-5.67%
jan 1, 1968
20.899
+1.169
5.93%
jan 1, 1969
18.966
-1.933
-9.25%
jan 1, 1970
16.229
-2.737
-14.43%
jan 1, 1971
16.712
+0.483
2.98%
jan 1, 1972
30.287
+13.575
81.23%
jan 1, 1973
41.993
+11.705
38.65%
jan 1, 1974
62.145
+20.152
47.99%
jan 1, 1975
43.52
-18.625
-29.97%
jan 1, 1976
57.96
+14.44
33.18%
jan 1, 1977
43.412
-14.549
-25.1%
jan 1, 1978
43.544
+0.132
0.3%
jan 1, 1979
40.831
-2.713
-6.23%
jan 1, 1980
43.489
+2.658
6.51%
jan 1, 1981
46.958
+3.469
7.98%
jan 1, 1982
51.239
+4.282
9.12%
jan 1, 1983
88.404
+37.165
72.53%
jan 1, 1984
86.856
-1.548
-1.75%
jan 1, 1985
107.369
+20.513
23.62%
jan 1, 1986
114.675
+7.305
6.8%
jan 1, 1987
108.351
-6.324
-5.51%
jan 1, 1988
97.108
-11.243
-10.38%
jan 1, 1989
83.096
-14.012
-14.43%
jan 1, 1990
73.937
-9.159
-11.02%
jan 1, 1991
70.184
-3.753
-5.08%
jan 1, 1992
60.791
-9.393
-13.38%
jan 1, 1993
58.082
-2.709
-4.46%
jan 1, 1994
60.859
+2.777
4.78%
jan 1, 1995
55.478
-5.381
-8.84%
jan 1, 1996
55.088
-0.39
-0.7%
jan 1, 1997
58.411
+3.323
6.03%
jan 1, 1998
62.818
+4.406
7.54%
jan 1, 1999
66.379
+3.561
5.67%
jan 1, 2000
70.018
+3.639
5.48%
jan 1, 2001
69.942
-0.076
-0.11%
jan 1, 2002
82.14
+12.197
17.44%
jan 1, 2003
84.674
+2.535
3.09%
jan 1, 2004
83.521
-1.153
-1.36%
jan 1, 2005
82.564
-0.957
-1.15%
jan 1, 2006
79.491
-3.073
-3.72%
jan 1, 2007
78.72
-0.771
-0.97%
jan 1, 2008
85.264
+6.543
8.31%
jan 1, 2009
102.71
+17.446
20.46%
jan 1, 2010
105.734
+3.025
2.94%
jan 1, 2011
104.776
-0.959
-0.91%
jan 1, 2012
109.244
+4.468
4.26%
jan 1, 2013
113.119
+3.874
3.55%
jan 1, 2014
115.47
+2.351
2.08%
jan 1, 2015
119.971
+4.501
3.9%
jan 1, 2016
123.263
+3.292
2.74%
Ranking of countries by current statistics by years


Comments: