29
/
en
AIzaSyAYiBZKx7MnpbEhh9jyipgxe19OcubqV5w
April 1, 2024
257170
Switzerland
CHE
true
2
1
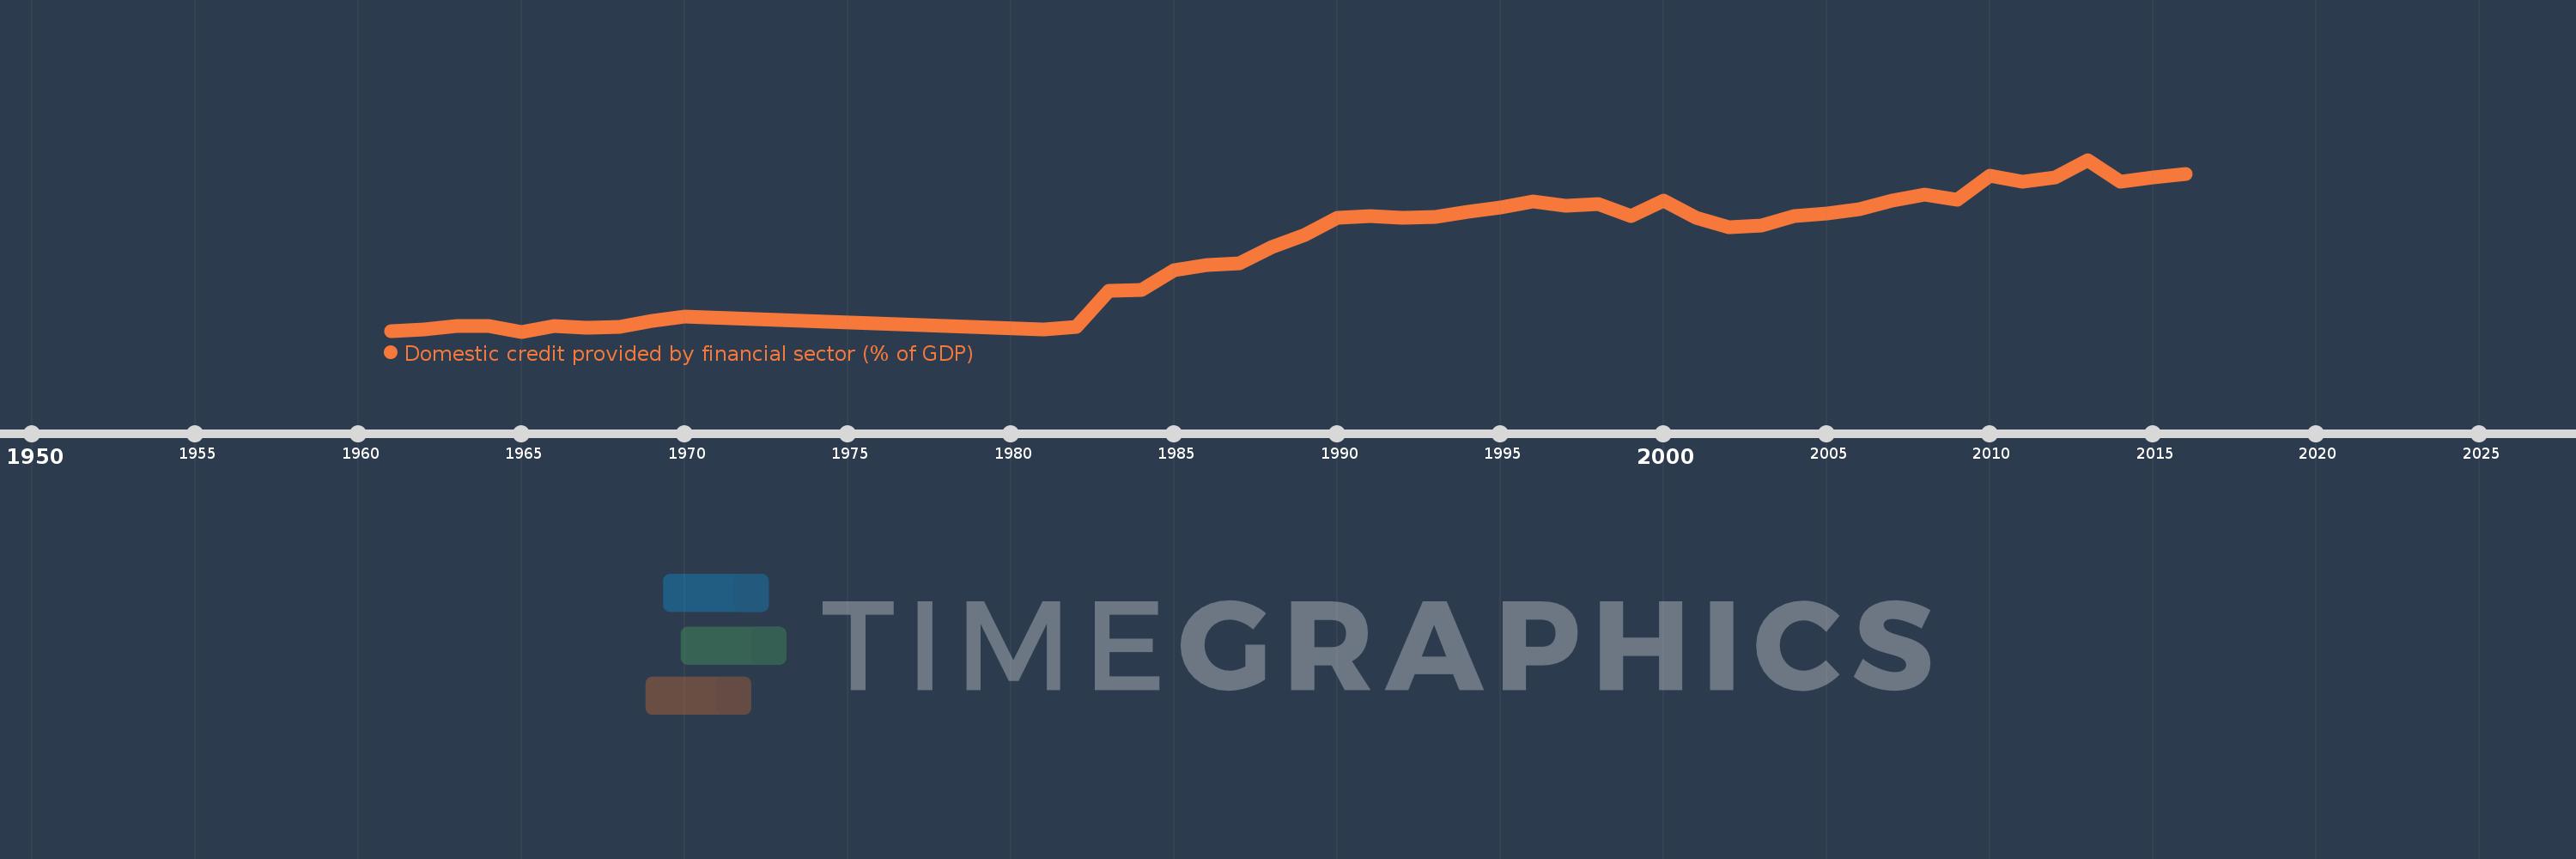
Domestic credit provided by financial sector (% of GDP)
2016,2015,2014,2013,2012,2011,2010,2009,2008,2007,2006,2005,2004,2003,2002,2001,2000,1999,1998,1997,1996,1995,1994,1993,1992,1991,1990,1989,1988,1987,1986,1985,1984,1983,1982,1981,1970,1969,1968,1967,1966,1965,1964,1963,1962,1961
This statistics in other country:
AfghanistanAlbaniaAlgeriaAngolaAntigua and BarbudaArab WorldArgentinaArmeniaArubaAustraliaAustriaAzerbaijanBahamas, TheBahrainBangladeshBarbadosBelarusBelgiumBelizeBeninBhutanBoliviaBosnia and HerzegovinaBotswanaBrazilBrunei DarussalamBulgariaBurkina FasoBurundiCabo VerdeCambodiaCameroonCanadaCaribbean small statesCentral African RepublicCentral Europe and the BalticsChadChileChinaColombiaComorosCongo, Dem. Rep.Congo, Rep.Costa RicaCote d'IvoireCroatiaCyprusCzech RepublicDenmarkDjiboutiDominicaDominican RepublicEarly-demographic dividendEast Asia & PacificEast Asia & Pacific (excluding high income)East Asia & Pacific (IDA & IBRD countries)EcuadorEgypt, Arab Rep.El SalvadorEquatorial GuineaEritreaEstoniaEthiopiaEuro areaEurope & Central AsiaEurope & Central Asia (excluding high income)Europe & Central Asia (IDA & IBRD countries)European UnionFijiFinlandFragile and conflict affected situationsFranceGabonGambia, TheGeorgiaGermanyGhanaGreeceGrenadaGuatemalaGuineaGuinea-BissauGuyanaHaitiHeavily indebted poor countries (HIPC)High incomeHondurasHong Kong SAR, ChinaHungaryIBRD onlyIcelandIDA & IBRD totalIDA blendIDA onlyIDA totalIndiaIndonesiaIran, Islamic Rep.IraqIrelandIsraelItalyJamaicaJapanJordanKazakhstanKenyaKorea, Rep.KosovoKuwaitKyrgyz RepublicLao PDRLate-demographic dividendLatin America & Caribbean Latin America & Caribbean (excluding high income)Latin America & the Caribbean (IDA & IBRD countries)LatviaLeast developed countries: UN classificationLebanonLesothoLiberiaLibyaLithuaniaLow & middle incomeLow incomeLower middle incomeLuxembourgMacao SAR, ChinaMacedonia, FYRMadagascarMalawiMalaysiaMaldivesMaliMaltaMauritaniaMauritiusMexicoMicronesia, Fed. Sts.Middle East & North AfricaMiddle East & North Africa (excluding high income)Middle East & North Africa (IDA & IBRD countries)Middle incomeMoldovaMongoliaMontenegroMoroccoMozambiqueMyanmarNamibiaNepalNetherlandsNew ZealandNicaraguaNigerNigeriaNorth AmericaNorwayOECD membersOmanOther small statesPacific island small statesPakistanPanamaPapua New GuineaParaguayPeruPhilippinesPolandPortugalPost-demographic dividendPre-demographic dividendQatarRomaniaRussian FederationRwandaSamoaSao Tome and PrincipeSaudi ArabiaSenegalSerbiaSeychellesSierra LeoneSingaporeSlovak RepublicSloveniaSmall statesSolomon IslandsSouth AfricaSouth AsiaSouth Asia (IDA & IBRD)South SudanSpainSri LankaSt. Kitts and NevisSt. LuciaSt. Vincent and the GrenadinesSub-Saharan Africa Sub-Saharan Africa (excluding high income)Sub-Saharan Africa (IDA & IBRD countries)SudanSurinameSwazilandSwedenSwitzerlandSyrian Arab RepublicTajikistanTanzaniaThailandTimor-LesteTogoTongaTrinidad and TobagoTunisiaTurkeyUgandaUkraineUnited Arab EmiratesUnited KingdomUnited StatesUpper middle incomeUruguayVanuatuVenezuela, RBVietnamWest Bank and GazaWorldYemen, Rep.ZambiaZimbabwe Timeline:
This timeline shows a graph from 1961 to 2016 of Switzerland. No data until 1960. Number of actual observations by date: 46.
Source name:
World Development Indicators
Source organization:
International Monetary Fund, International Financial Statistics and data files, and World Bank and OECD GDP estimates.
Categories, topics:
Financial Sector
Last updated:
apr 23, 2017
Indicators value changes by year
Minimum:
108.814
jan 1, 1965
Maximum:
183.115
jan 1, 2013
At the date of observation
Value
Absolute change
Change from previous value
jan 1, 1961
108.937
+108.937
0.0%
jan 1, 1962
109.742
+0.805
0.74%
jan 1, 1963
111.05
+1.308
1.19%
jan 1, 1964
111.057
+0.007
0.01%
jan 1, 1965
108.814
-2.243
-2.02%
jan 1, 1966
111.231
+2.417
2.22%
jan 1, 1967
110.548
-0.683
-0.61%
jan 1, 1968
110.821
+0.273
0.25%
jan 1, 1969
113.34
+2.519
2.27%
jan 1, 1970
115.316
+1.976
1.74%
jan 1, 1981
109.817
-5.499
-4.77%
jan 1, 1982
110.951
+1.134
1.03%
jan 1, 1983
126.6
+15.649
14.1%
jan 1, 1984
126.967
+0.367
0.29%
jan 1, 1985
135.359
+8.392
6.61%
jan 1, 1986
137.766
+2.408
1.78%
jan 1, 1987
138.422
+0.656
0.48%
jan 1, 1988
145.581
+7.158
5.17%
jan 1, 1989
150.424
+4.843
3.33%
jan 1, 1990
158.126
+7.702
5.12%
jan 1, 1991
158.825
+0.699
0.44%
jan 1, 1992
158.034
-0.792
-0.5%
jan 1, 1993
158.594
+0.56
0.35%
jan 1, 1994
160.726
+2.133
1.34%
jan 1, 1995
162.381
+1.655
1.03%
jan 1, 1996
164.915
+2.534
1.56%
jan 1, 1997
163.23
-1.685
-1.02%
jan 1, 1998
164.089
+0.859
0.53%
jan 1, 1999
158.822
-5.267
-3.21%
jan 1, 2000
165.324
+6.501
4.09%
jan 1, 2001
158.187
-7.137
-4.32%
jan 1, 2002
153.878
-4.309
-2.72%
jan 1, 2003
154.865
+0.987
0.64%
jan 1, 2004
158.868
+4.003
2.58%
jan 1, 2005
159.993
+1.125
0.71%
jan 1, 2006
161.778
+1.785
1.12%
jan 1, 2007
165.528
+3.75
2.32%
jan 1, 2008
168.121
+2.593
1.57%
jan 1, 2009
165.843
-2.278
-1.35%
jan 1, 2010
176.145
+10.301
6.21%
jan 1, 2011
173.536
-2.608
-1.48%
jan 1, 2012
175.643
+2.107
1.21%
jan 1, 2013
183.115
+7.472
4.25%
jan 1, 2014
173.581
-9.534
-5.21%
jan 1, 2015
175.569
+1.988
1.15%
jan 1, 2016
177.141
+1.571
0.89%
Ranking of countries by current statistics by years


Comments: