29
/
en
AIzaSyAYiBZKx7MnpbEhh9jyipgxe19OcubqV5w
April 1, 2024
108422
Comoros
COM
true
2
1
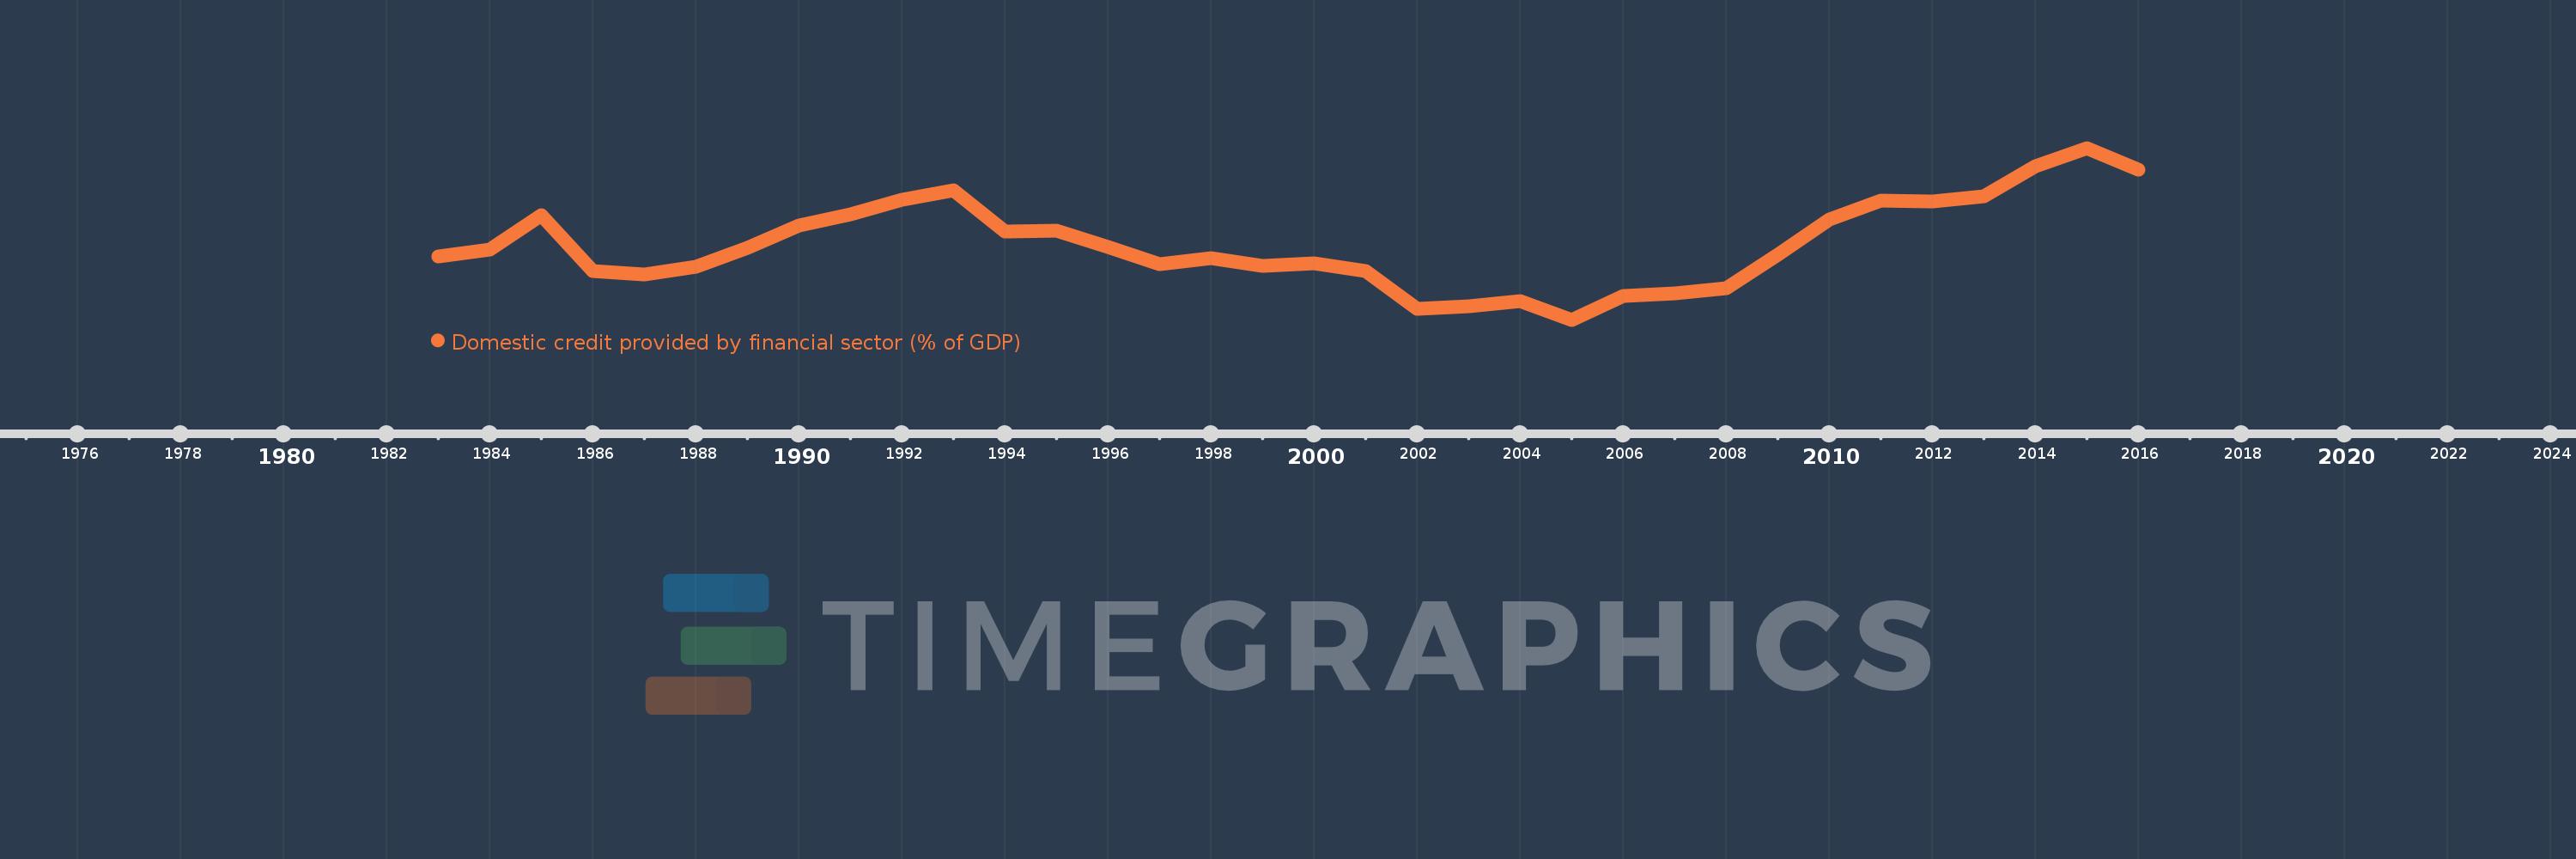
Domestic credit provided by financial sector (% of GDP)
2016,2015,2014,2013,2012,2011,2010,2009,2008,2007,2006,2005,2004,2003,2002,2001,2000,1999,1998,1997,1996,1995,1994,1993,1992,1991,1990,1989,1988,1987,1986,1985,1984,1983
This statistics in other country:
AfghanistanAlbaniaAlgeriaAngolaAntigua and BarbudaArab WorldArgentinaArmeniaArubaAustraliaAustriaAzerbaijanBahamas, TheBahrainBangladeshBarbadosBelarusBelgiumBelizeBeninBhutanBoliviaBosnia and HerzegovinaBotswanaBrazilBrunei DarussalamBulgariaBurkina FasoBurundiCabo VerdeCambodiaCameroonCanadaCaribbean small statesCentral African RepublicCentral Europe and the BalticsChadChileChinaColombiaComorosCongo, Dem. Rep.Congo, Rep.Costa RicaCote d'IvoireCroatiaCyprusCzech RepublicDenmarkDjiboutiDominicaDominican RepublicEarly-demographic dividendEast Asia & PacificEast Asia & Pacific (excluding high income)East Asia & Pacific (IDA & IBRD countries)EcuadorEgypt, Arab Rep.El SalvadorEquatorial GuineaEritreaEstoniaEthiopiaEuro areaEurope & Central AsiaEurope & Central Asia (excluding high income)Europe & Central Asia (IDA & IBRD countries)European UnionFijiFinlandFragile and conflict affected situationsFranceGabonGambia, TheGeorgiaGermanyGhanaGreeceGrenadaGuatemalaGuineaGuinea-BissauGuyanaHaitiHeavily indebted poor countries (HIPC)High incomeHondurasHong Kong SAR, ChinaHungaryIBRD onlyIcelandIDA & IBRD totalIDA blendIDA onlyIDA totalIndiaIndonesiaIran, Islamic Rep.IraqIrelandIsraelItalyJamaicaJapanJordanKazakhstanKenyaKorea, Rep.KosovoKuwaitKyrgyz RepublicLao PDRLate-demographic dividendLatin America & Caribbean Latin America & Caribbean (excluding high income)Latin America & the Caribbean (IDA & IBRD countries)LatviaLeast developed countries: UN classificationLebanonLesothoLiberiaLibyaLithuaniaLow & middle incomeLow incomeLower middle incomeLuxembourgMacao SAR, ChinaMacedonia, FYRMadagascarMalawiMalaysiaMaldivesMaliMaltaMauritaniaMauritiusMexicoMicronesia, Fed. Sts.Middle East & North AfricaMiddle East & North Africa (excluding high income)Middle East & North Africa (IDA & IBRD countries)Middle incomeMoldovaMongoliaMontenegroMoroccoMozambiqueMyanmarNamibiaNepalNetherlandsNew ZealandNicaraguaNigerNigeriaNorth AmericaNorwayOECD membersOmanOther small statesPacific island small statesPakistanPanamaPapua New GuineaParaguayPeruPhilippinesPolandPortugalPost-demographic dividendPre-demographic dividendQatarRomaniaRussian FederationRwandaSamoaSao Tome and PrincipeSaudi ArabiaSenegalSerbiaSeychellesSierra LeoneSingaporeSlovak RepublicSloveniaSmall statesSolomon IslandsSouth AfricaSouth AsiaSouth Asia (IDA & IBRD)South SudanSpainSri LankaSt. Kitts and NevisSt. LuciaSt. Vincent and the GrenadinesSub-Saharan Africa Sub-Saharan Africa (excluding high income)Sub-Saharan Africa (IDA & IBRD countries)SudanSurinameSwazilandSwedenSwitzerlandSyrian Arab RepublicTajikistanTanzaniaThailandTimor-LesteTogoTongaTrinidad and TobagoTunisiaTurkeyUgandaUkraineUnited Arab EmiratesUnited KingdomUnited StatesUpper middle incomeUruguayVanuatuVenezuela, RBVietnamWest Bank and GazaWorldYemen, Rep.ZambiaZimbabwe Timeline:
This timeline shows a graph from 1983 to 2016 of Comoros. No data until 1982. Number of actual observations by date: 34.
Source name:
World Development Indicators
Source organization:
International Monetary Fund, International Financial Statistics and data files, and World Bank and OECD GDP estimates.
Categories, topics:
Financial Sector
Last updated:
apr 23, 2017
Indicators value changes by year
Maximum:
28.114
jan 1, 2015
At the date of observation
Value
Absolute change
Change from previous value
jan 1, 1983
15.831
+15.831
0.0%
jan 1, 1984
16.59
+0.759
4.79%
jan 1, 1985
20.446
+3.856
23.24%
jan 1, 1986
14.189
-6.257
-30.6%
jan 1, 1987
13.75
-0.439
-3.09%
jan 1, 1988
14.662
+0.913
6.64%
jan 1, 1989
16.813
+2.151
14.67%
jan 1, 1990
19.275
+2.462
14.64%
jan 1, 1991
20.569
+1.293
6.71%
jan 1, 1992
22.288
+1.719
8.36%
jan 1, 1993
23.268
+0.98
4.4%
jan 1, 1994
18.634
-4.634
-19.91%
jan 1, 1995
18.737
+0.103
0.55%
jan 1, 1996
16.876
-1.861
-9.93%
jan 1, 1997
14.974
-1.901
-11.27%
jan 1, 1998
15.613
+0.639
4.27%
jan 1, 1999
14.732
-0.881
-5.64%
jan 1, 2000
15.017
+0.285
1.94%
jan 1, 2001
14.149
-0.868
-5.78%
jan 1, 2002
9.841
-4.308
-30.45%
jan 1, 2003
10.125
+0.285
2.89%
jan 1, 2004
10.788
+0.663
6.55%
jan 1, 2005
8.641
-2.147
-19.9%
jan 1, 2006
11.386
+2.744
31.76%
jan 1, 2007
11.626
+0.241
2.11%
jan 1, 2008
12.177
+0.551
4.74%
jan 1, 2009
16.046
+3.869
31.77%
jan 1, 2010
20.025
+3.98
24.8%
jan 1, 2011
22.179
+2.153
10.75%
jan 1, 2012
22.095
-0.083
-0.37%
jan 1, 2013
22.585
+0.489
2.21%
jan 1, 2014
26.041
+3.456
15.3%
jan 1, 2015
28.114
+2.074
7.96%
jan 1, 2016
25.671
-2.443
-8.69%
Ranking of countries by current statistics by years


Comments: