29
/
en
AIzaSyAYiBZKx7MnpbEhh9jyipgxe19OcubqV5w
April 1, 2024
228321
Romania
ROU
true
2
1
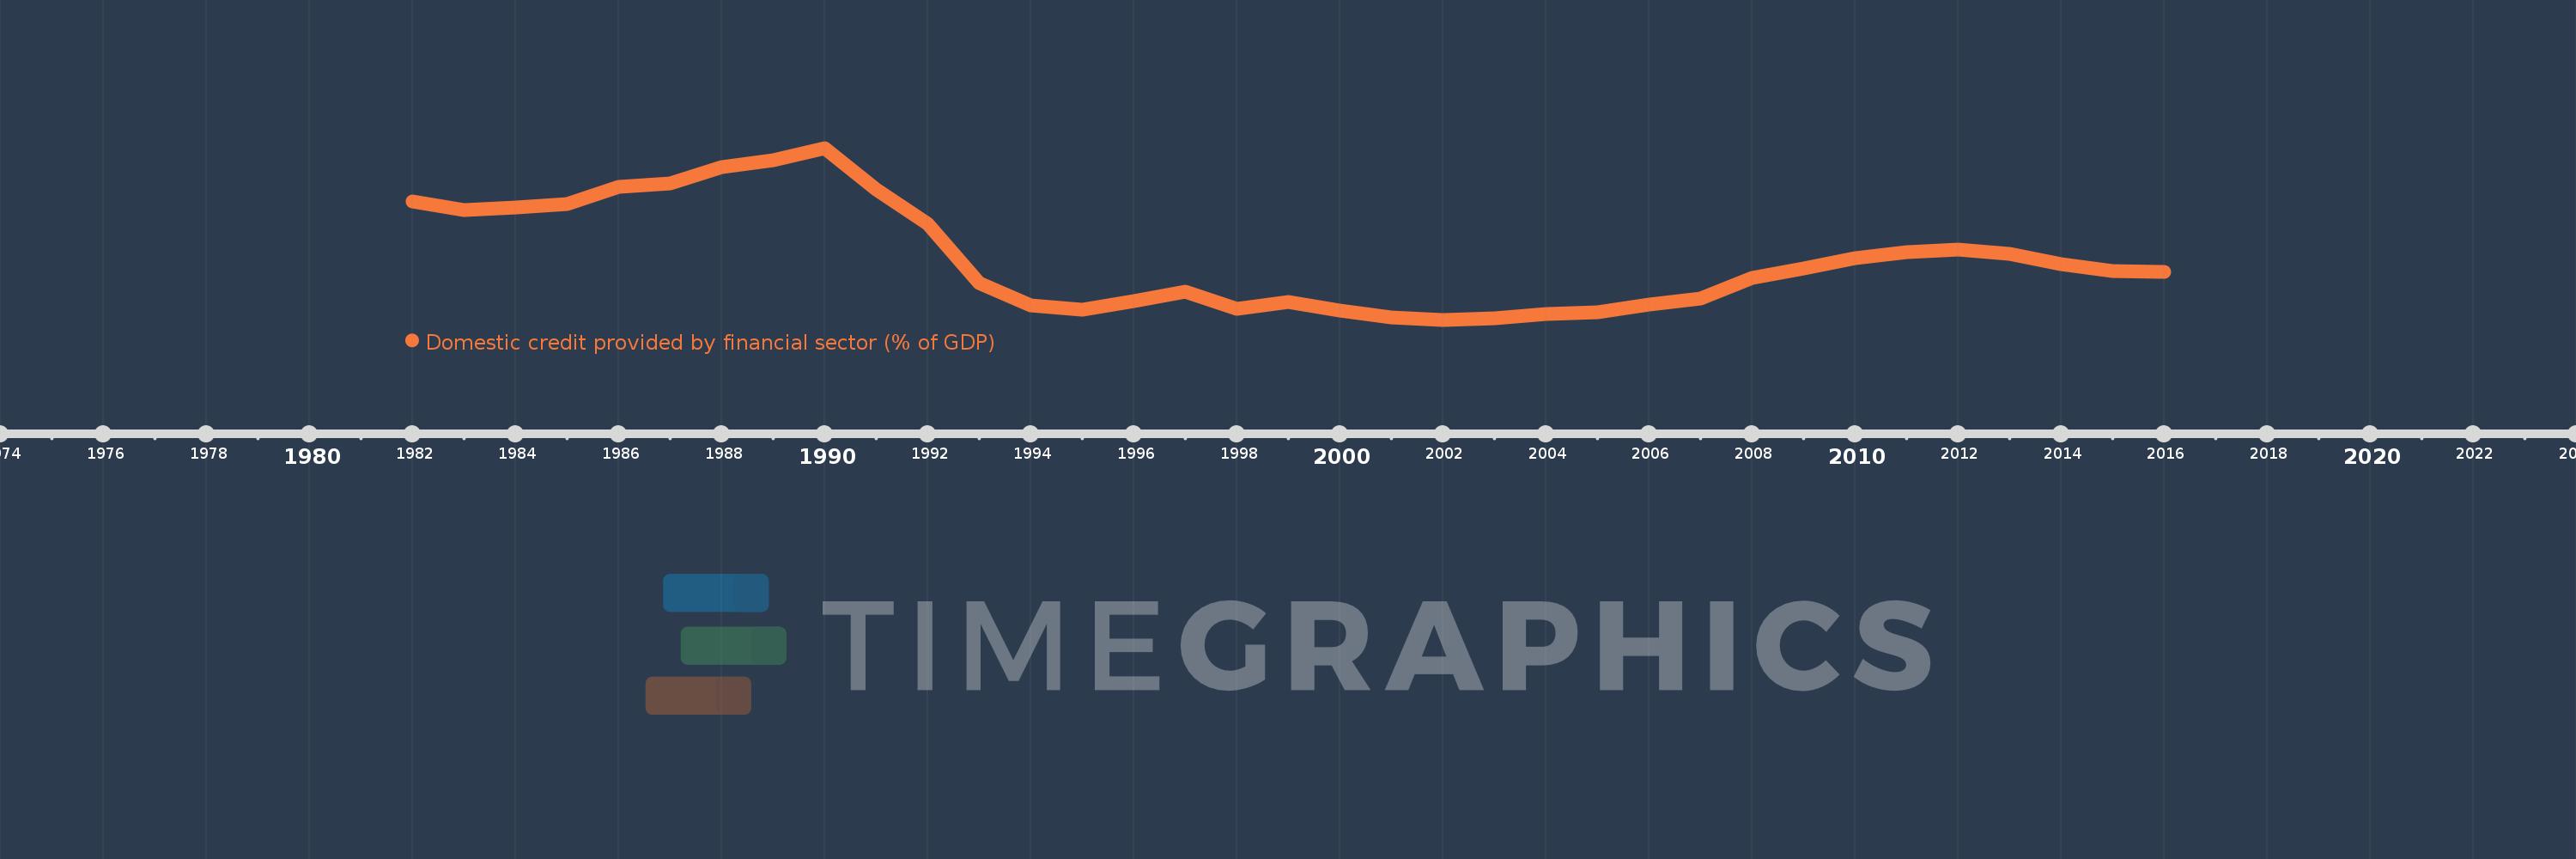
Domestic credit provided by financial sector (% of GDP)
2016,2015,2014,2013,2012,2011,2010,2009,2008,2007,2006,2005,2004,2003,2002,2001,2000,1999,1998,1997,1996,1995,1994,1993,1992,1991,1990,1989,1988,1987,1986,1985,1984,1983,1982
This statistics in other country:
AfghanistanAlbaniaAlgeriaAngolaAntigua and BarbudaArab WorldArgentinaArmeniaArubaAustraliaAustriaAzerbaijanBahamas, TheBahrainBangladeshBarbadosBelarusBelgiumBelizeBeninBhutanBoliviaBosnia and HerzegovinaBotswanaBrazilBrunei DarussalamBulgariaBurkina FasoBurundiCabo VerdeCambodiaCameroonCanadaCaribbean small statesCentral African RepublicCentral Europe and the BalticsChadChileChinaColombiaComorosCongo, Dem. Rep.Congo, Rep.Costa RicaCote d'IvoireCroatiaCyprusCzech RepublicDenmarkDjiboutiDominicaDominican RepublicEarly-demographic dividendEast Asia & PacificEast Asia & Pacific (excluding high income)East Asia & Pacific (IDA & IBRD countries)EcuadorEgypt, Arab Rep.El SalvadorEquatorial GuineaEritreaEstoniaEthiopiaEuro areaEurope & Central AsiaEurope & Central Asia (excluding high income)Europe & Central Asia (IDA & IBRD countries)European UnionFijiFinlandFragile and conflict affected situationsFranceGabonGambia, TheGeorgiaGermanyGhanaGreeceGrenadaGuatemalaGuineaGuinea-BissauGuyanaHaitiHeavily indebted poor countries (HIPC)High incomeHondurasHong Kong SAR, ChinaHungaryIBRD onlyIcelandIDA & IBRD totalIDA blendIDA onlyIDA totalIndiaIndonesiaIran, Islamic Rep.IraqIrelandIsraelItalyJamaicaJapanJordanKazakhstanKenyaKorea, Rep.KosovoKuwaitKyrgyz RepublicLao PDRLate-demographic dividendLatin America & Caribbean Latin America & Caribbean (excluding high income)Latin America & the Caribbean (IDA & IBRD countries)LatviaLeast developed countries: UN classificationLebanonLesothoLiberiaLibyaLithuaniaLow & middle incomeLow incomeLower middle incomeLuxembourgMacao SAR, ChinaMacedonia, FYRMadagascarMalawiMalaysiaMaldivesMaliMaltaMauritaniaMauritiusMexicoMicronesia, Fed. Sts.Middle East & North AfricaMiddle East & North Africa (excluding high income)Middle East & North Africa (IDA & IBRD countries)Middle incomeMoldovaMongoliaMontenegroMoroccoMozambiqueMyanmarNamibiaNepalNetherlandsNew ZealandNicaraguaNigerNigeriaNorth AmericaNorwayOECD membersOmanOther small statesPacific island small statesPakistanPanamaPapua New GuineaParaguayPeruPhilippinesPolandPortugalPost-demographic dividendPre-demographic dividendQatarRomaniaRussian FederationRwandaSamoaSao Tome and PrincipeSaudi ArabiaSenegalSerbiaSeychellesSierra LeoneSingaporeSlovak RepublicSloveniaSmall statesSolomon IslandsSouth AfricaSouth AsiaSouth Asia (IDA & IBRD)South SudanSpainSri LankaSt. Kitts and NevisSt. LuciaSt. Vincent and the GrenadinesSub-Saharan Africa Sub-Saharan Africa (excluding high income)Sub-Saharan Africa (IDA & IBRD countries)SudanSurinameSwazilandSwedenSwitzerlandSyrian Arab RepublicTajikistanTanzaniaThailandTimor-LesteTogoTongaTrinidad and TobagoTunisiaTurkeyUgandaUkraineUnited Arab EmiratesUnited KingdomUnited StatesUpper middle incomeUruguayVanuatuVenezuela, RBVietnamWest Bank and GazaWorldYemen, Rep.ZambiaZimbabwe Timeline:
This timeline shows a graph from 1982 to 2016 of Romania. No data until 1981. Number of actual observations by date: 35.
Source name:
World Development Indicators
Source organization:
International Monetary Fund, International Financial Statistics and data files, and World Bank and OECD GDP estimates.
Categories, topics:
Financial Sector
Last updated:
apr 23, 2017
Indicators value changes by year
Minimum:
12.815
jan 1, 2002
Maximum:
101.301
jan 1, 1990
At the date of observation
Value
Absolute change
Change from previous value
jan 1, 1982
73.635
+73.635
0.0%
jan 1, 1983
69.252
-4.383
-5.95%
jan 1, 1984
70.783
+1.532
2.21%
jan 1, 1985
72.208
+1.424
2.01%
jan 1, 1986
81.457
+9.249
12.81%
jan 1, 1987
83.109
+1.652
2.03%
jan 1, 1988
91.545
+8.436
10.15%
jan 1, 1989
94.878
+3.333
3.64%
jan 1, 1990
101.301
+6.423
6.77%
jan 1, 1991
79.724
-21.576
-21.3%
jan 1, 1992
62.397
-17.328
-21.73%
jan 1, 1993
31.705
-30.692
-49.19%
jan 1, 1994
20.194
-11.512
-36.31%
jan 1, 1995
17.825
-2.368
-11.73%
jan 1, 1996
22.195
+4.369
24.51%
jan 1, 1997
27.41
+5.216
23.5%
jan 1, 1998
18.418
-8.992
-32.8%
jan 1, 1999
21.753
+3.335
18.11%
jan 1, 2000
17.536
-4.217
-19.39%
jan 1, 2001
13.834
-3.702
-21.11%
jan 1, 2002
12.815
-1.02
-7.37%
jan 1, 2003
13.771
+0.956
7.46%
jan 1, 2004
15.754
+1.984
14.41%
jan 1, 2005
16.744
+0.99
6.29%
jan 1, 2006
20.6
+3.855
23.02%
jan 1, 2007
23.88
+3.28
15.92%
jan 1, 2008
34.563
+10.683
44.73%
jan 1, 2009
39.317
+4.754
13.76%
jan 1, 2010
44.657
+5.34
13.58%
jan 1, 2011
47.618
+2.961
6.63%
jan 1, 2012
48.89
+1.272
2.67%
jan 1, 2013
46.632
-2.257
-4.62%
jan 1, 2014
41.658
-4.974
-10.67%
jan 1, 2015
37.919
-3.739
-8.98%
jan 1, 2016
37.513
-0.406
-1.07%
Ranking of countries by current statistics by years


Comments: