29
/
en
AIzaSyAYiBZKx7MnpbEhh9jyipgxe19OcubqV5w
April 1, 2024
256189
Sweden
SWE
true
2
1
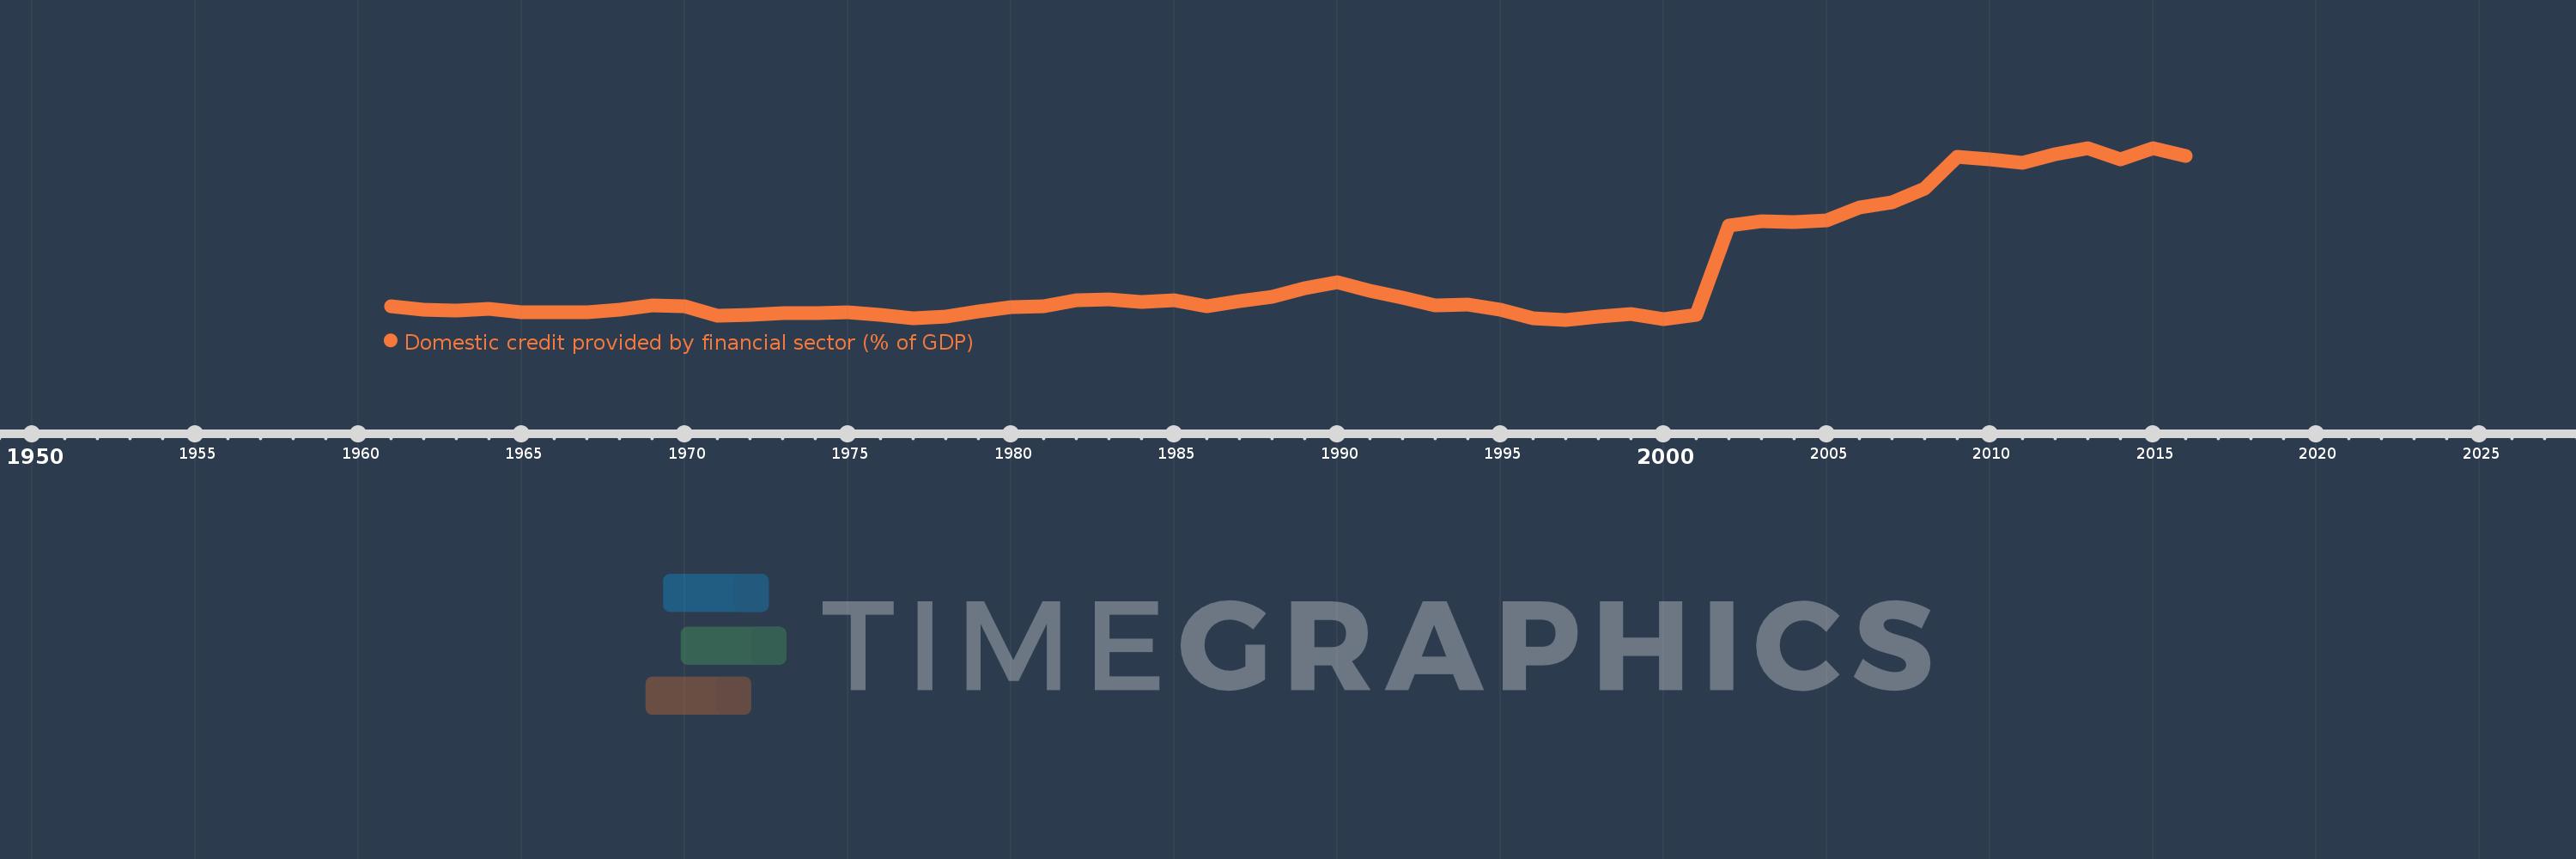
Domestic credit provided by financial sector (% of GDP)
2016,2015,2014,2013,2012,2011,2010,2009,2008,2007,2006,2005,2004,2003,2002,2001,2000,1999,1998,1997,1996,1995,1994,1993,1992,1991,1990,1989,1988,1987,1986,1985,1984,1983,1982,1981,1980,1979,1978,1977,1976,1975,1974,1973,1972,1971,1970,1969,1968,1967,1966,1965,1964,1963,1962,1961
This statistics in other country:
AfghanistanAlbaniaAlgeriaAngolaAntigua and BarbudaArab WorldArgentinaArmeniaArubaAustraliaAustriaAzerbaijanBahamas, TheBahrainBangladeshBarbadosBelarusBelgiumBelizeBeninBhutanBoliviaBosnia and HerzegovinaBotswanaBrazilBrunei DarussalamBulgariaBurkina FasoBurundiCabo VerdeCambodiaCameroonCanadaCaribbean small statesCentral African RepublicCentral Europe and the BalticsChadChileChinaColombiaComorosCongo, Dem. Rep.Congo, Rep.Costa RicaCote d'IvoireCroatiaCyprusCzech RepublicDenmarkDjiboutiDominicaDominican RepublicEarly-demographic dividendEast Asia & PacificEast Asia & Pacific (excluding high income)East Asia & Pacific (IDA & IBRD countries)EcuadorEgypt, Arab Rep.El SalvadorEquatorial GuineaEritreaEstoniaEthiopiaEuro areaEurope & Central AsiaEurope & Central Asia (excluding high income)Europe & Central Asia (IDA & IBRD countries)European UnionFijiFinlandFragile and conflict affected situationsFranceGabonGambia, TheGeorgiaGermanyGhanaGreeceGrenadaGuatemalaGuineaGuinea-BissauGuyanaHaitiHeavily indebted poor countries (HIPC)High incomeHondurasHong Kong SAR, ChinaHungaryIBRD onlyIcelandIDA & IBRD totalIDA blendIDA onlyIDA totalIndiaIndonesiaIran, Islamic Rep.IraqIrelandIsraelItalyJamaicaJapanJordanKazakhstanKenyaKorea, Rep.KosovoKuwaitKyrgyz RepublicLao PDRLate-demographic dividendLatin America & Caribbean Latin America & Caribbean (excluding high income)Latin America & the Caribbean (IDA & IBRD countries)LatviaLeast developed countries: UN classificationLebanonLesothoLiberiaLibyaLithuaniaLow & middle incomeLow incomeLower middle incomeLuxembourgMacao SAR, ChinaMacedonia, FYRMadagascarMalawiMalaysiaMaldivesMaliMaltaMauritaniaMauritiusMexicoMicronesia, Fed. Sts.Middle East & North AfricaMiddle East & North Africa (excluding high income)Middle East & North Africa (IDA & IBRD countries)Middle incomeMoldovaMongoliaMontenegroMoroccoMozambiqueMyanmarNamibiaNepalNetherlandsNew ZealandNicaraguaNigerNigeriaNorth AmericaNorwayOECD membersOmanOther small statesPacific island small statesPakistanPanamaPapua New GuineaParaguayPeruPhilippinesPolandPortugalPost-demographic dividendPre-demographic dividendQatarRomaniaRussian FederationRwandaSamoaSao Tome and PrincipeSaudi ArabiaSenegalSerbiaSeychellesSierra LeoneSingaporeSlovak RepublicSloveniaSmall statesSolomon IslandsSouth AfricaSouth AsiaSouth Asia (IDA & IBRD)South SudanSpainSri LankaSt. Kitts and NevisSt. LuciaSt. Vincent and the GrenadinesSub-Saharan Africa Sub-Saharan Africa (excluding high income)Sub-Saharan Africa (IDA & IBRD countries)SudanSurinameSwazilandSwedenSwitzerlandSyrian Arab RepublicTajikistanTanzaniaThailandTimor-LesteTogoTongaTrinidad and TobagoTunisiaTurkeyUgandaUkraineUnited Arab EmiratesUnited KingdomUnited StatesUpper middle incomeUruguayVanuatuVenezuela, RBVietnamWest Bank and GazaWorldYemen, Rep.ZambiaZimbabwe Timeline:
This timeline shows a graph from 1961 to 2016 of Sweden. No data until 1960. Number of actual observations by date: 56.
Source name:
World Development Indicators
Source organization:
International Monetary Fund, International Financial Statistics and data files, and World Bank and OECD GDP estimates.
Categories, topics:
Financial Sector
Last updated:
apr 23, 2017
Indicators value changes by year
Minimum:
43.112
jan 1, 1997
Maximum:
156.744
jan 1, 2015
At the date of observation
Value
Absolute change
Change from previous value
jan 1, 1961
52.188
+52.188
0.0%
jan 1, 1962
49.834
-2.354
-4.51%
jan 1, 1963
49.2
-0.634
-1.27%
jan 1, 1964
50.22
+1.02
2.07%
jan 1, 1965
48.159
-2.061
-4.1%
jan 1, 1966
47.945
-0.214
-0.44%
jan 1, 1967
47.935
-0.011
-0.02%
jan 1, 1968
49.824
+1.889
3.94%
jan 1, 1969
52.743
+2.919
5.86%
jan 1, 1970
52.099
-0.644
-1.22%
jan 1, 1971
45.909
-6.19
-11.88%
jan 1, 1972
46.362
+0.453
0.99%
jan 1, 1973
47.682
+1.32
2.85%
jan 1, 1974
47.521
-0.161
-0.34%
jan 1, 1975
47.975
+0.454
0.96%
jan 1, 1976
46.439
-1.536
-3.2%
jan 1, 1977
44.288
-2.151
-4.63%
jan 1, 1978
45.217
+0.93
2.1%
jan 1, 1979
48.872
+3.654
8.08%
jan 1, 1980
51.567
+2.695
5.51%
jan 1, 1981
51.827
+0.261
0.51%
jan 1, 1982
56.229
+4.402
8.49%
jan 1, 1983
56.688
+0.459
0.82%
jan 1, 1984
54.988
-1.7
-3.0%
jan 1, 1985
56.214
+1.226
2.23%
jan 1, 1986
52.128
-4.086
-7.27%
jan 1, 1987
55.183
+3.055
5.86%
jan 1, 1988
58.155
+2.972
5.39%
jan 1, 1989
63.745
+5.59
9.61%
jan 1, 1990
68.056
+4.311
6.76%
jan 1, 1991
62.258
-5.798
-8.52%
jan 1, 1992
57.552
-4.705
-7.56%
jan 1, 1993
52.395
-5.158
-8.96%
jan 1, 1994
53.383
+0.989
1.89%
jan 1, 1995
49.99
-3.393
-6.36%
jan 1, 1996
44.309
-5.681
-11.36%
jan 1, 1997
43.112
-1.197
-2.7%
jan 1, 1998
45.031
+1.919
4.45%
jan 1, 1999
47.042
+2.012
4.47%
jan 1, 2000
43.463
-3.579
-7.61%
jan 1, 2001
46.262
+2.799
6.44%
jan 1, 2002
105.215
+58.953
127.43%
jan 1, 2003
108.004
+2.79
2.65%
jan 1, 2004
107.898
-0.106
-0.1%
jan 1, 2005
108.608
+0.709
0.66%
jan 1, 2006
117.094
+8.486
7.81%
jan 1, 2007
120.928
+3.834
3.27%
jan 1, 2008
129.733
+8.805
7.28%
jan 1, 2009
150.748
+21.015
16.2%
jan 1, 2010
149.227
-1.521
-1.01%
jan 1, 2011
146.853
-2.374
-1.59%
jan 1, 2012
152.466
+5.613
3.82%
jan 1, 2013
156.558
+4.091
2.68%
jan 1, 2014
149.25
-7.307
-4.67%
jan 1, 2015
156.744
+7.494
5.02%
jan 1, 2016
151.456
-5.289
-3.37%
Ranking of countries by current statistics by years


Comments: