29
/
en
AIzaSyAYiBZKx7MnpbEhh9jyipgxe19OcubqV5w
April 1, 2024
29757
Euro area
EMU
false
2
1
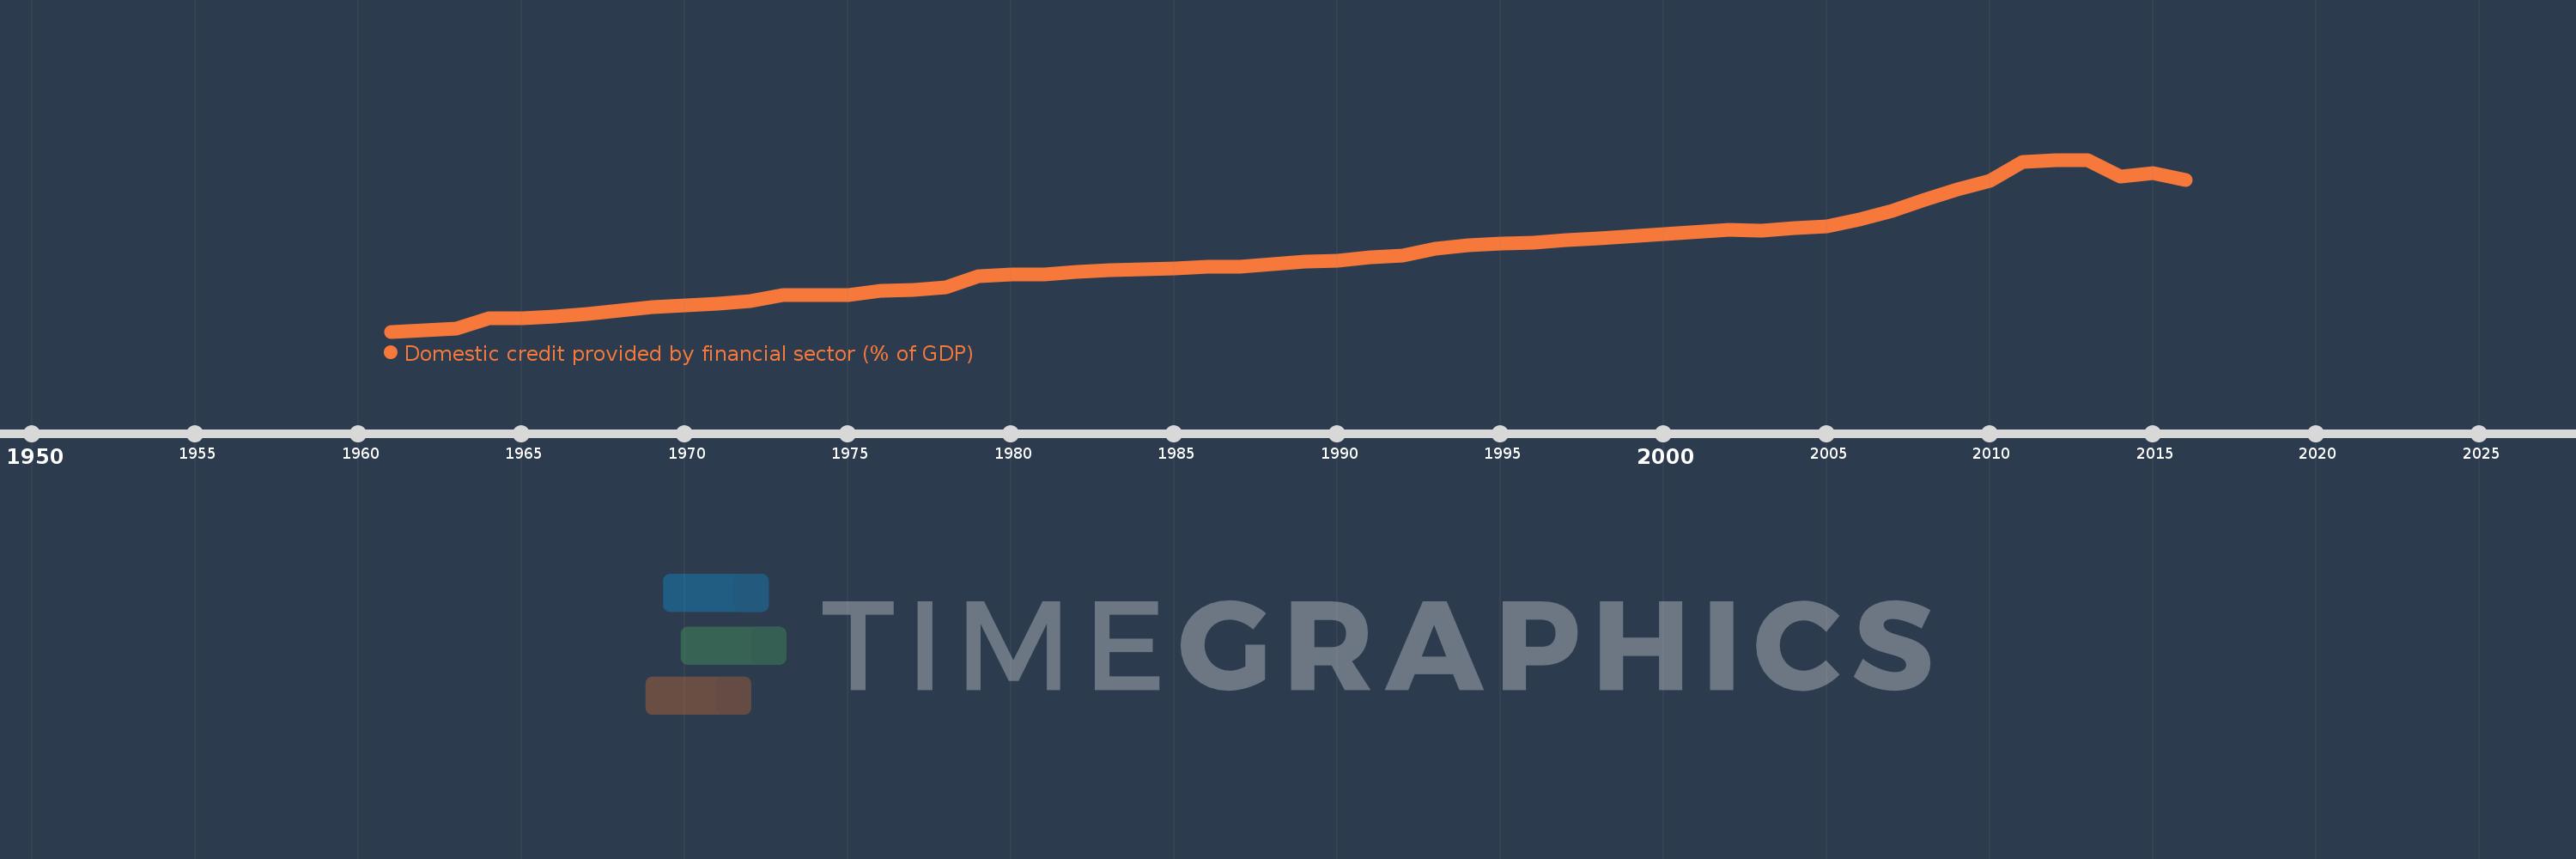
Domestic credit provided by financial sector (% of GDP)
2016,2015,2014,2013,2012,2011,2010,2009,2008,2007,2006,2005,2004,2003,2002,1998,1997,1996,1995,1994,1993,1992,1991,1990,1989,1988,1987,1986,1985,1984,1983,1982,1981,1980,1979,1978,1977,1976,1975,1974,1973,1972,1971,1970,1969,1968,1967,1966,1965,1964,1963,1962,1961
This statistics in other country:
AfghanistanAlbaniaAlgeriaAngolaAntigua and BarbudaArab WorldArgentinaArmeniaArubaAustraliaAustriaAzerbaijanBahamas, TheBahrainBangladeshBarbadosBelarusBelgiumBelizeBeninBhutanBoliviaBosnia and HerzegovinaBotswanaBrazilBrunei DarussalamBulgariaBurkina FasoBurundiCabo VerdeCambodiaCameroonCanadaCaribbean small statesCentral African RepublicCentral Europe and the BalticsChadChileChinaColombiaComorosCongo, Dem. Rep.Congo, Rep.Costa RicaCote d'IvoireCroatiaCyprusCzech RepublicDenmarkDjiboutiDominicaDominican RepublicEarly-demographic dividendEast Asia & PacificEast Asia & Pacific (excluding high income)East Asia & Pacific (IDA & IBRD countries)EcuadorEgypt, Arab Rep.El SalvadorEquatorial GuineaEritreaEstoniaEthiopiaEuro areaEurope & Central AsiaEurope & Central Asia (excluding high income)Europe & Central Asia (IDA & IBRD countries)European UnionFijiFinlandFragile and conflict affected situationsFranceGabonGambia, TheGeorgiaGermanyGhanaGreeceGrenadaGuatemalaGuineaGuinea-BissauGuyanaHaitiHeavily indebted poor countries (HIPC)High incomeHondurasHong Kong SAR, ChinaHungaryIBRD onlyIcelandIDA & IBRD totalIDA blendIDA onlyIDA totalIndiaIndonesiaIran, Islamic Rep.IraqIrelandIsraelItalyJamaicaJapanJordanKazakhstanKenyaKorea, Rep.KosovoKuwaitKyrgyz RepublicLao PDRLate-demographic dividendLatin America & Caribbean Latin America & Caribbean (excluding high income)Latin America & the Caribbean (IDA & IBRD countries)LatviaLeast developed countries: UN classificationLebanonLesothoLiberiaLibyaLithuaniaLow & middle incomeLow incomeLower middle incomeLuxembourgMacao SAR, ChinaMacedonia, FYRMadagascarMalawiMalaysiaMaldivesMaliMaltaMauritaniaMauritiusMexicoMicronesia, Fed. Sts.Middle East & North AfricaMiddle East & North Africa (excluding high income)Middle East & North Africa (IDA & IBRD countries)Middle incomeMoldovaMongoliaMontenegroMoroccoMozambiqueMyanmarNamibiaNepalNetherlandsNew ZealandNicaraguaNigerNigeriaNorth AmericaNorwayOECD membersOmanOther small statesPacific island small statesPakistanPanamaPapua New GuineaParaguayPeruPhilippinesPolandPortugalPost-demographic dividendPre-demographic dividendQatarRomaniaRussian FederationRwandaSamoaSao Tome and PrincipeSaudi ArabiaSenegalSerbiaSeychellesSierra LeoneSingaporeSlovak RepublicSloveniaSmall statesSolomon IslandsSouth AfricaSouth AsiaSouth Asia (IDA & IBRD)South SudanSpainSri LankaSt. Kitts and NevisSt. LuciaSt. Vincent and the GrenadinesSub-Saharan Africa Sub-Saharan Africa (excluding high income)Sub-Saharan Africa (IDA & IBRD countries)SudanSurinameSwazilandSwedenSwitzerlandSyrian Arab RepublicTajikistanTanzaniaThailandTimor-LesteTogoTongaTrinidad and TobagoTunisiaTurkeyUgandaUkraineUnited Arab EmiratesUnited KingdomUnited StatesUpper middle incomeUruguayVanuatuVenezuela, RBVietnamWest Bank and GazaWorldYemen, Rep.ZambiaZimbabwe Timeline:
This timeline shows a graph from 1961 to 2016 of Euro area. No data until 1960. Number of actual observations by date: 53.
Source name:
World Development Indicators
Source organization:
International Monetary Fund, International Financial Statistics and data files, and World Bank and OECD GDP estimates.
Categories, topics:
Financial Sector
Last updated:
apr 23, 2017
Indicators value changes by year
Minimum:
35.302
jan 1, 1961
Maximum:
170.953
jan 1, 2012
At the date of observation
Value
Absolute change
Change from previous value
jan 1, 1961
35.302
+35.302
0.0%
jan 1, 1962
36.435
+1.133
3.21%
jan 1, 1963
37.629
+1.193
3.28%
jan 1, 1964
46.009
+8.38
22.27%
jan 1, 1965
45.771
-0.238
-0.52%
jan 1, 1966
47.456
+1.685
3.68%
jan 1, 1967
49.457
+2.001
4.22%
jan 1, 1968
51.764
+2.307
4.66%
jan 1, 1969
54.842
+3.078
5.95%
jan 1, 1970
55.954
+1.112
2.03%
jan 1, 1971
57.012
+1.058
1.89%
jan 1, 1972
59.436
+2.424
4.25%
jan 1, 1973
63.814
+4.378
7.37%
jan 1, 1974
63.857
+0.043
0.07%
jan 1, 1975
64.181
+0.324
0.51%
jan 1, 1976
67.71
+3.529
5.5%
jan 1, 1977
68.275
+0.566
0.84%
jan 1, 1978
69.992
+1.716
2.51%
jan 1, 1979
78.87
+8.879
12.69%
jan 1, 1980
80.096
+1.226
1.55%
jan 1, 1981
80.365
+0.269
0.34%
jan 1, 1982
82.203
+1.838
2.29%
jan 1, 1983
84.073
+1.87
2.27%
jan 1, 1984
84.558
+0.486
0.58%
jan 1, 1985
85.369
+0.81
0.96%
jan 1, 1986
86.607
+1.238
1.45%
jan 1, 1987
86.754
+0.148
0.17%
jan 1, 1988
88.374
+1.62
1.87%
jan 1, 1989
90.429
+2.054
2.32%
jan 1, 1990
91.156
+0.727
0.8%
jan 1, 1991
94.125
+2.969
3.26%
jan 1, 1992
95.477
+1.352
1.44%
jan 1, 1993
101.048
+5.572
5.84%
jan 1, 1994
103.191
+2.143
2.12%
jan 1, 1995
104.571
+1.38
1.34%
jan 1, 1996
105.63
+1.06
1.01%
jan 1, 1997
107.498
+1.867
1.77%
jan 1, 1998
108.726
+1.228
1.14%
jan 1, 2002
115.828
+7.103
6.53%
jan 1, 2003
114.99
-0.838
-0.72%
jan 1, 2004
117.365
+2.375
2.07%
jan 1, 2005
118.255
+0.889
0.76%
jan 1, 2006
123.529
+5.274
4.46%
jan 1, 2007
130.93
+7.401
5.99%
jan 1, 2008
139.665
+8.736
6.67%
jan 1, 2009
147.226
+7.561
5.41%
jan 1, 2010
154.252
+7.025
4.77%
jan 1, 2011
169.298
+15.047
9.75%
jan 1, 2012
170.953
+1.655
0.98%
jan 1, 2013
170.655
-0.298
-0.17%
jan 1, 2014
157.838
-12.817
-7.51%
jan 1, 2015
160.594
+2.756
1.75%
jan 1, 2016
154.768
-5.826
-3.63%
Ranking of countries by current statistics by years


Comments: