29
/
en
AIzaSyAYiBZKx7MnpbEhh9jyipgxe19OcubqV5w
April 1, 2024
37267
IDA & IBRD total
IBT
false
2
1
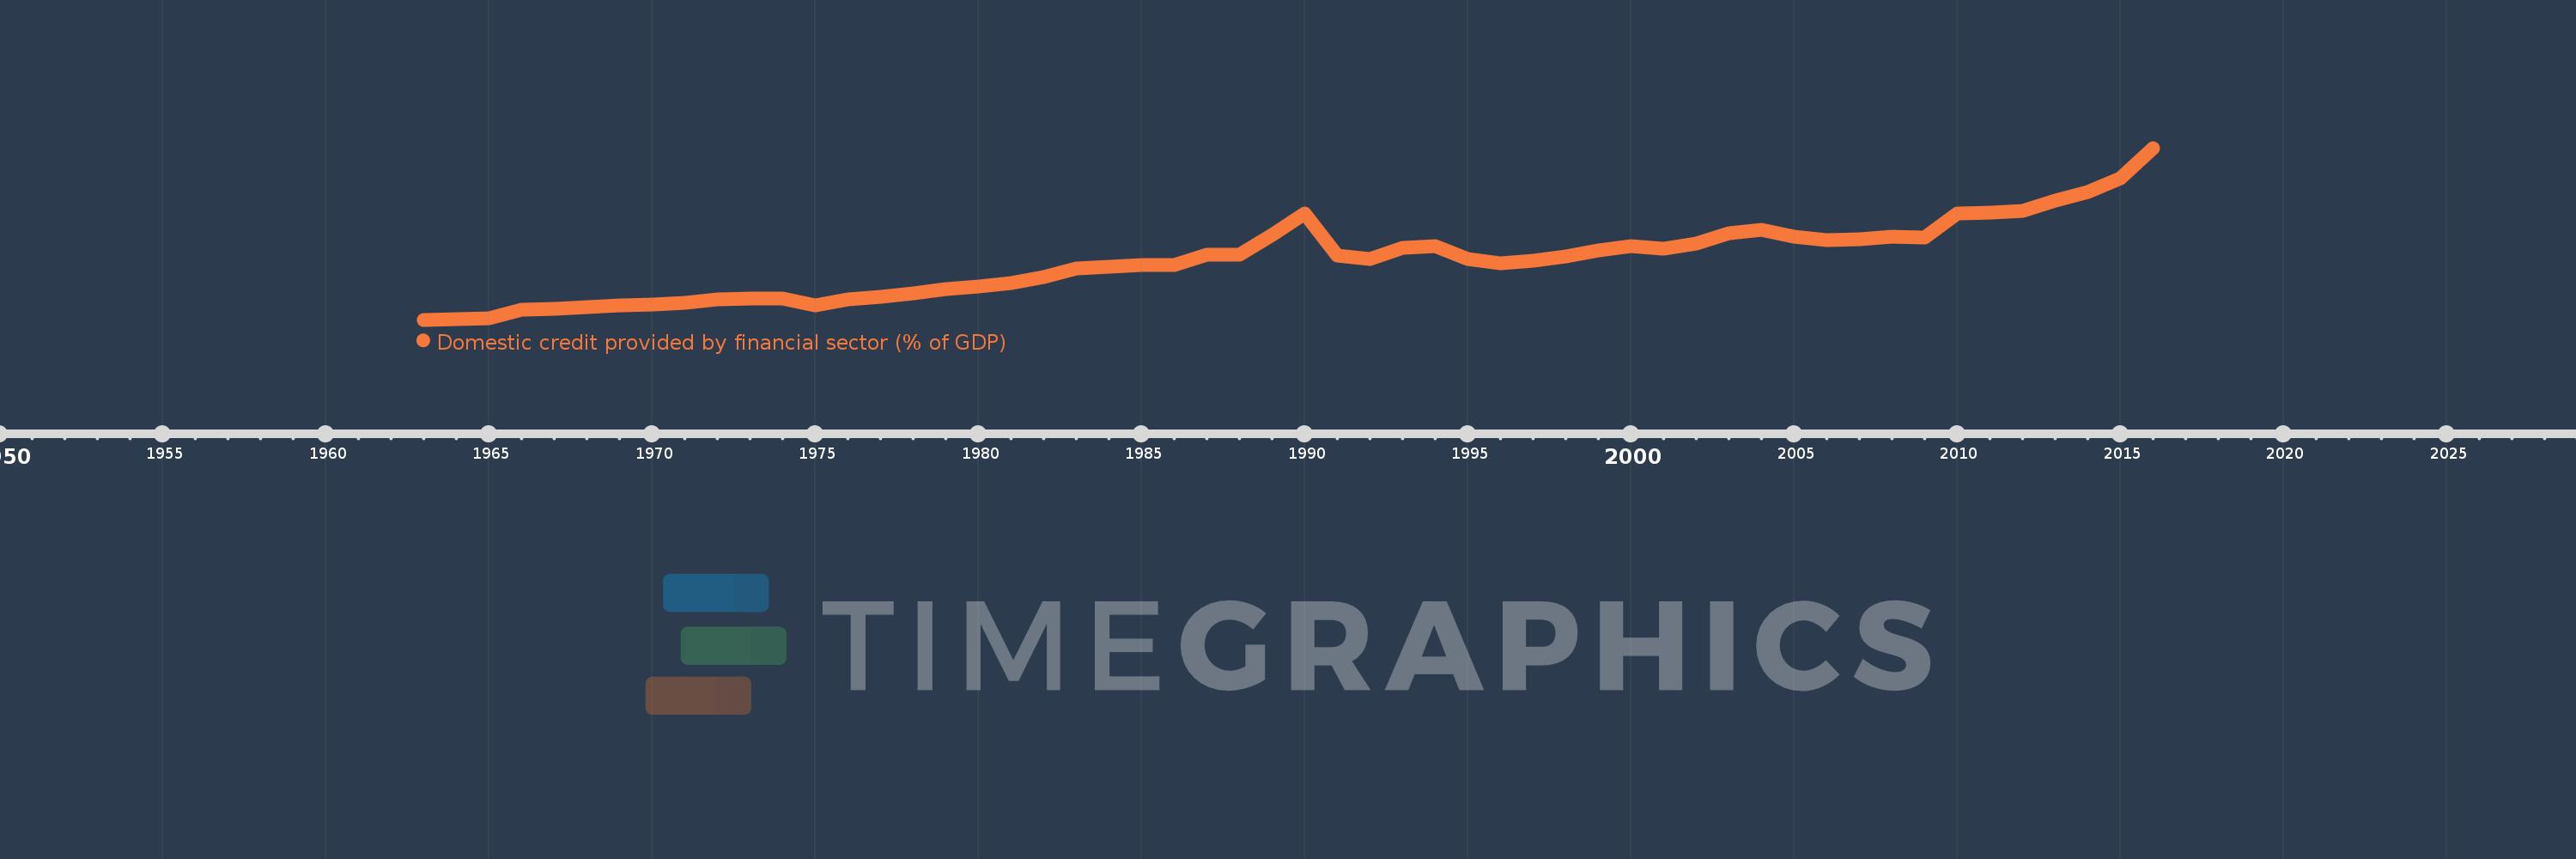
Domestic credit provided by financial sector (% of GDP)
2016,2015,2014,2013,2012,2011,2010,2009,2008,2007,2006,2005,2004,2003,2002,2001,2000,1999,1998,1997,1996,1995,1994,1993,1992,1991,1990,1989,1988,1987,1986,1985,1984,1983,1982,1981,1980,1979,1978,1977,1976,1975,1974,1973,1972,1971,1970,1969,1968,1967,1966,1965,1964,1963
This statistics in other country:
AfghanistanAlbaniaAlgeriaAngolaAntigua and BarbudaArab WorldArgentinaArmeniaArubaAustraliaAustriaAzerbaijanBahamas, TheBahrainBangladeshBarbadosBelarusBelgiumBelizeBeninBhutanBoliviaBosnia and HerzegovinaBotswanaBrazilBrunei DarussalamBulgariaBurkina FasoBurundiCabo VerdeCambodiaCameroonCanadaCaribbean small statesCentral African RepublicCentral Europe and the BalticsChadChileChinaColombiaComorosCongo, Dem. Rep.Congo, Rep.Costa RicaCote d'IvoireCroatiaCyprusCzech RepublicDenmarkDjiboutiDominicaDominican RepublicEarly-demographic dividendEast Asia & PacificEast Asia & Pacific (excluding high income)East Asia & Pacific (IDA & IBRD countries)EcuadorEgypt, Arab Rep.El SalvadorEquatorial GuineaEritreaEstoniaEthiopiaEuro areaEurope & Central AsiaEurope & Central Asia (excluding high income)Europe & Central Asia (IDA & IBRD countries)European UnionFijiFinlandFragile and conflict affected situationsFranceGabonGambia, TheGeorgiaGermanyGhanaGreeceGrenadaGuatemalaGuineaGuinea-BissauGuyanaHaitiHeavily indebted poor countries (HIPC)High incomeHondurasHong Kong SAR, ChinaHungaryIBRD onlyIcelandIDA & IBRD totalIDA blendIDA onlyIDA totalIndiaIndonesiaIran, Islamic Rep.IraqIrelandIsraelItalyJamaicaJapanJordanKazakhstanKenyaKorea, Rep.KosovoKuwaitKyrgyz RepublicLao PDRLate-demographic dividendLatin America & Caribbean Latin America & Caribbean (excluding high income)Latin America & the Caribbean (IDA & IBRD countries)LatviaLeast developed countries: UN classificationLebanonLesothoLiberiaLibyaLithuaniaLow & middle incomeLow incomeLower middle incomeLuxembourgMacao SAR, ChinaMacedonia, FYRMadagascarMalawiMalaysiaMaldivesMaliMaltaMauritaniaMauritiusMexicoMicronesia, Fed. Sts.Middle East & North AfricaMiddle East & North Africa (excluding high income)Middle East & North Africa (IDA & IBRD countries)Middle incomeMoldovaMongoliaMontenegroMoroccoMozambiqueMyanmarNamibiaNepalNetherlandsNew ZealandNicaraguaNigerNigeriaNorth AmericaNorwayOECD membersOmanOther small statesPacific island small statesPakistanPanamaPapua New GuineaParaguayPeruPhilippinesPolandPortugalPost-demographic dividendPre-demographic dividendQatarRomaniaRussian FederationRwandaSamoaSao Tome and PrincipeSaudi ArabiaSenegalSerbiaSeychellesSierra LeoneSingaporeSlovak RepublicSloveniaSmall statesSolomon IslandsSouth AfricaSouth AsiaSouth Asia (IDA & IBRD)South SudanSpainSri LankaSt. Kitts and NevisSt. LuciaSt. Vincent and the GrenadinesSub-Saharan Africa Sub-Saharan Africa (excluding high income)Sub-Saharan Africa (IDA & IBRD countries)SudanSurinameSwazilandSwedenSwitzerlandSyrian Arab RepublicTajikistanTanzaniaThailandTimor-LesteTogoTongaTrinidad and TobagoTunisiaTurkeyUgandaUkraineUnited Arab EmiratesUnited KingdomUnited StatesUpper middle incomeUruguayVanuatuVenezuela, RBVietnamWest Bank and GazaWorldYemen, Rep.ZambiaZimbabwe Timeline:
This timeline shows a graph from 1963 to 2016 of IDA & IBRD total. No data until 1962. Number of actual observations by date: 54.
Source name:
World Development Indicators
Source organization:
International Monetary Fund, International Financial Statistics and data files, and World Bank and OECD GDP estimates.
Categories, topics:
Financial Sector
Last updated:
apr 23, 2017
Indicators value changes by year
Minimum:
21.405
jan 1, 1963
Maximum:
123.62
jan 1, 2016
At the date of observation
Value
Absolute change
Change from previous value
jan 1, 1963
21.405
+21.405
0.0%
jan 1, 1964
21.926
+0.521
2.43%
jan 1, 1965
22.316
+0.391
1.78%
jan 1, 1966
27.541
+5.225
23.41%
jan 1, 1967
28.078
+0.537
1.95%
jan 1, 1968
28.992
+0.913
3.25%
jan 1, 1969
29.911
+0.919
3.17%
jan 1, 1970
30.41
+0.499
1.67%
jan 1, 1971
31.284
+0.873
2.87%
jan 1, 1972
33.29
+2.006
6.41%
jan 1, 1973
34.084
+0.794
2.38%
jan 1, 1974
34.218
+0.135
0.4%
jan 1, 1975
30.175
-4.044
-11.82%
jan 1, 1976
33.494
+3.32
11.0%
jan 1, 1977
34.9
+1.406
4.2%
jan 1, 1978
37.143
+2.243
6.43%
jan 1, 1979
39.625
+2.482
6.68%
jan 1, 1980
41.17
+1.545
3.9%
jan 1, 1981
43.036
+1.867
4.53%
jan 1, 1982
46.843
+3.806
8.84%
jan 1, 1983
51.974
+5.131
10.95%
jan 1, 1984
52.985
+1.011
1.95%
jan 1, 1985
53.713
+0.728
1.37%
jan 1, 1986
54.147
+0.434
0.81%
jan 1, 1987
59.864
+5.717
10.56%
jan 1, 1988
59.862
-0.002
0.0%
jan 1, 1989
71.86
+11.998
20.04%
jan 1, 1990
84.779
+12.92
17.98%
jan 1, 1991
59.384
-25.395
-29.95%
jan 1, 1992
57.668
-1.716
-2.89%
jan 1, 1993
64.274
+6.606
11.46%
jan 1, 1994
65.287
+1.012
1.58%
jan 1, 1995
57.349
-7.938
-12.16%
jan 1, 1996
54.746
-2.603
-4.54%
jan 1, 1997
56.508
+1.762
3.22%
jan 1, 1998
59.276
+2.768
4.9%
jan 1, 1999
62.559
+3.283
5.54%
jan 1, 2000
65.066
+2.508
4.01%
jan 1, 2001
63.519
-1.547
-2.38%
jan 1, 2002
66.493
+2.974
4.68%
jan 1, 2003
73.011
+6.518
9.8%
jan 1, 2004
75.081
+2.07
2.83%
jan 1, 2005
71.019
-4.062
-5.41%
jan 1, 2006
68.695
-2.324
-3.27%
jan 1, 2007
69.365
+0.67
0.98%
jan 1, 2008
70.676
+1.31
1.89%
jan 1, 2009
70.303
-0.373
-0.53%
jan 1, 2010
84.441
+14.138
20.11%
jan 1, 2011
85.164
+0.723
0.86%
jan 1, 2012
86.361
+1.197
1.41%
jan 1, 2013
92.431
+6.07
7.03%
jan 1, 2014
97.525
+5.094
5.51%
jan 1, 2015
105.515
+7.99
8.19%
jan 1, 2016
123.62
+18.105
17.16%
Ranking of countries by current statistics by years


Comments: