29
/
en
AIzaSyAYiBZKx7MnpbEhh9jyipgxe19OcubqV5w
April 1, 2024
163637
Japan
JPN
true
2
1
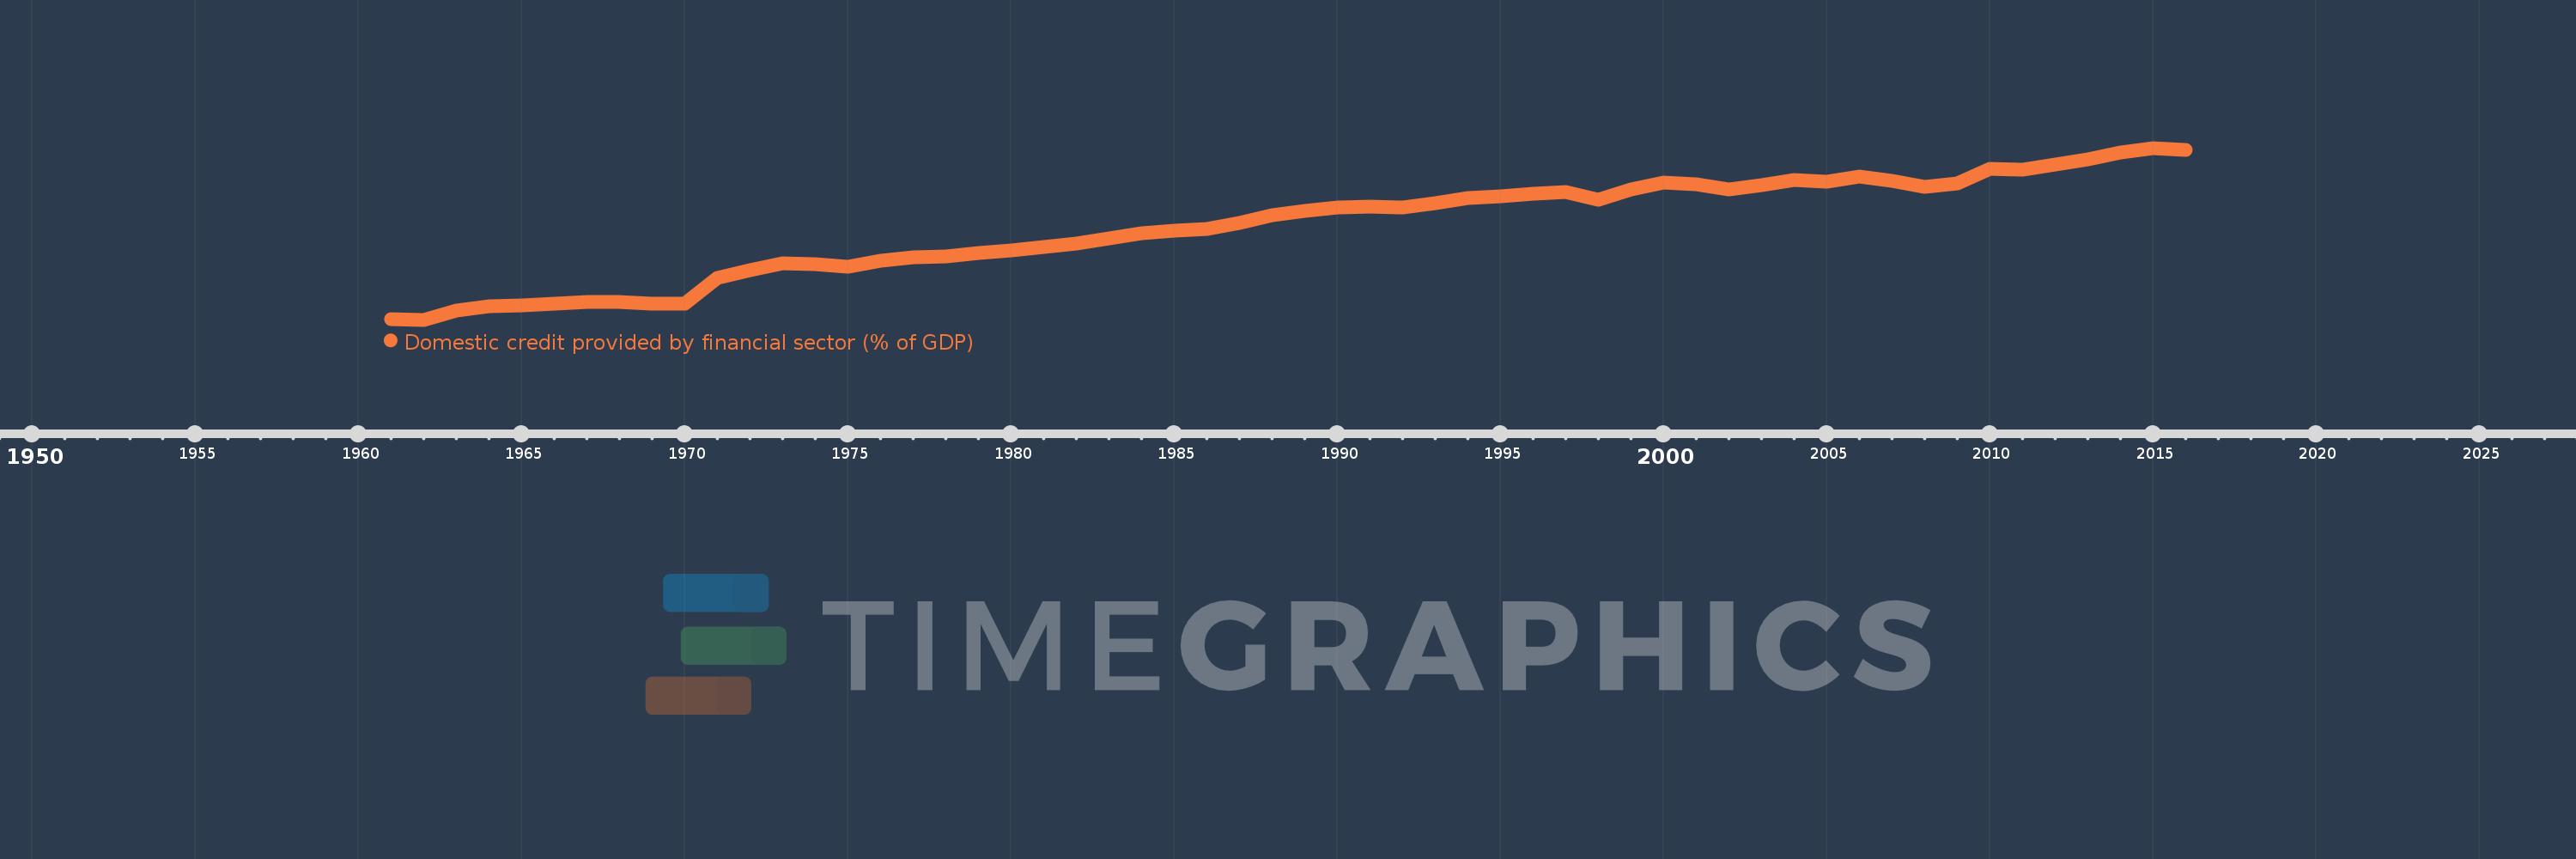
Domestic credit provided by financial sector (% of GDP)
2016,2015,2014,2013,2012,2011,2010,2009,2008,2007,2006,2005,2004,2003,2002,2001,2000,1999,1998,1997,1996,1995,1994,1993,1992,1991,1990,1989,1988,1987,1986,1985,1984,1983,1982,1981,1980,1979,1978,1977,1976,1975,1974,1973,1972,1971,1970,1969,1968,1967,1966,1965,1964,1963,1962,1961
This statistics in other country:
AfghanistanAlbaniaAlgeriaAngolaAntigua and BarbudaArab WorldArgentinaArmeniaArubaAustraliaAustriaAzerbaijanBahamas, TheBahrainBangladeshBarbadosBelarusBelgiumBelizeBeninBhutanBoliviaBosnia and HerzegovinaBotswanaBrazilBrunei DarussalamBulgariaBurkina FasoBurundiCabo VerdeCambodiaCameroonCanadaCaribbean small statesCentral African RepublicCentral Europe and the BalticsChadChileChinaColombiaComorosCongo, Dem. Rep.Congo, Rep.Costa RicaCote d'IvoireCroatiaCyprusCzech RepublicDenmarkDjiboutiDominicaDominican RepublicEarly-demographic dividendEast Asia & PacificEast Asia & Pacific (excluding high income)East Asia & Pacific (IDA & IBRD countries)EcuadorEgypt, Arab Rep.El SalvadorEquatorial GuineaEritreaEstoniaEthiopiaEuro areaEurope & Central AsiaEurope & Central Asia (excluding high income)Europe & Central Asia (IDA & IBRD countries)European UnionFijiFinlandFragile and conflict affected situationsFranceGabonGambia, TheGeorgiaGermanyGhanaGreeceGrenadaGuatemalaGuineaGuinea-BissauGuyanaHaitiHeavily indebted poor countries (HIPC)High incomeHondurasHong Kong SAR, ChinaHungaryIBRD onlyIcelandIDA & IBRD totalIDA blendIDA onlyIDA totalIndiaIndonesiaIran, Islamic Rep.IraqIrelandIsraelItalyJamaicaJapanJordanKazakhstanKenyaKorea, Rep.KosovoKuwaitKyrgyz RepublicLao PDRLate-demographic dividendLatin America & Caribbean Latin America & Caribbean (excluding high income)Latin America & the Caribbean (IDA & IBRD countries)LatviaLeast developed countries: UN classificationLebanonLesothoLiberiaLibyaLithuaniaLow & middle incomeLow incomeLower middle incomeLuxembourgMacao SAR, ChinaMacedonia, FYRMadagascarMalawiMalaysiaMaldivesMaliMaltaMauritaniaMauritiusMexicoMicronesia, Fed. Sts.Middle East & North AfricaMiddle East & North Africa (excluding high income)Middle East & North Africa (IDA & IBRD countries)Middle incomeMoldovaMongoliaMontenegroMoroccoMozambiqueMyanmarNamibiaNepalNetherlandsNew ZealandNicaraguaNigerNigeriaNorth AmericaNorwayOECD membersOmanOther small statesPacific island small statesPakistanPanamaPapua New GuineaParaguayPeruPhilippinesPolandPortugalPost-demographic dividendPre-demographic dividendQatarRomaniaRussian FederationRwandaSamoaSao Tome and PrincipeSaudi ArabiaSenegalSerbiaSeychellesSierra LeoneSingaporeSlovak RepublicSloveniaSmall statesSolomon IslandsSouth AfricaSouth AsiaSouth Asia (IDA & IBRD)South SudanSpainSri LankaSt. Kitts and NevisSt. LuciaSt. Vincent and the GrenadinesSub-Saharan Africa Sub-Saharan Africa (excluding high income)Sub-Saharan Africa (IDA & IBRD countries)SudanSurinameSwazilandSwedenSwitzerlandSyrian Arab RepublicTajikistanTanzaniaThailandTimor-LesteTogoTongaTrinidad and TobagoTunisiaTurkeyUgandaUkraineUnited Arab EmiratesUnited KingdomUnited StatesUpper middle incomeUruguayVanuatuVenezuela, RBVietnamWest Bank and GazaWorldYemen, Rep.ZambiaZimbabwe Timeline:
This timeline shows a graph from 1961 to 2016 of Japan. No data until 1960. Number of actual observations by date: 56.
Source name:
World Development Indicators
Source organization:
International Monetary Fund, International Financial Statistics and data files, and World Bank and OECD GDP estimates.
Categories, topics:
Financial Sector
Last updated:
apr 23, 2017
Indicators value changes by year
Minimum:
59.783
jan 1, 1962
Maximum:
357.319
jan 1, 2015
At the date of observation
Value
Absolute change
Change from previous value
jan 1, 1961
60.305
+60.305
0.0%
jan 1, 1962
59.783
-0.522
-0.87%
jan 1, 1963
76.074
+16.291
27.25%
jan 1, 1964
82.9
+6.826
8.97%
jan 1, 1965
83.977
+1.077
1.3%
jan 1, 1966
88.076
+4.1
4.88%
jan 1, 1967
89.978
+1.901
2.16%
jan 1, 1968
90.327
+0.349
0.39%
jan 1, 1969
87.357
-2.97
-3.29%
jan 1, 1970
87.009
-0.348
-0.4%
jan 1, 1971
132.275
+45.265
52.02%
jan 1, 1972
145.417
+13.142
9.94%
jan 1, 1973
157.935
+12.518
8.61%
jan 1, 1974
155.546
-2.389
-1.51%
jan 1, 1975
151.738
-3.808
-2.45%
jan 1, 1976
161.986
+10.248
6.75%
jan 1, 1977
167.457
+5.471
3.38%
jan 1, 1978
169.91
+2.453
1.46%
jan 1, 1979
175.672
+5.762
3.39%
jan 1, 1980
180.354
+4.683
2.67%
jan 1, 1981
185.664
+5.31
2.94%
jan 1, 1982
191.235
+5.57
3.0%
jan 1, 1983
200.987
+9.753
5.1%
jan 1, 1984
209.982
+8.994
4.48%
jan 1, 1985
214.571
+4.59
2.19%
jan 1, 1986
216.855
+2.284
1.06%
jan 1, 1987
226.842
+9.987
4.61%
jan 1, 1988
240.262
+13.42
5.92%
jan 1, 1989
247.982
+7.72
3.21%
jan 1, 1990
254.333
+6.351
2.56%
jan 1, 1991
255.342
+1.009
0.4%
jan 1, 1992
253.752
-1.589
-0.62%
jan 1, 1993
261.428
+7.676
3.03%
jan 1, 1994
269.97
+8.542
3.27%
jan 1, 1995
273.687
+3.716
1.38%
jan 1, 1996
277.399
+3.712
1.36%
jan 1, 1997
280.859
+3.46
1.25%
jan 1, 1998
266.894
-13.965
-4.97%
jan 1, 1999
285.413
+18.52
6.94%
jan 1, 2000
296.784
+11.371
3.98%
jan 1, 2001
294.997
-1.787
-0.6%
jan 1, 2002
285.17
-9.827
-3.33%
jan 1, 2003
293.152
+7.983
2.8%
jan 1, 2004
302.109
+8.956
3.06%
jan 1, 2005
298.363
-3.746
-1.24%
jan 1, 2006
307.958
+9.595
3.22%
jan 1, 2007
300.785
-7.173
-2.33%
jan 1, 2008
290.39
-10.395
-3.46%
jan 1, 2009
295.554
+5.165
1.78%
jan 1, 2010
320.678
+25.124
8.5%
jan 1, 2011
320.239
-0.439
-0.14%
jan 1, 2012
328.976
+8.737
2.73%
jan 1, 2013
337.811
+8.834
2.69%
jan 1, 2014
350.075
+12.265
3.63%
jan 1, 2015
357.319
+7.243
2.07%
jan 1, 2016
354.359
-2.96
-0.83%
Ranking of countries by current statistics by years


Comments: