29
/
en
AIzaSyAYiBZKx7MnpbEhh9jyipgxe19OcubqV5w
April 1, 2024
258191
Syrian Arab Republic
SYR
true
2
1
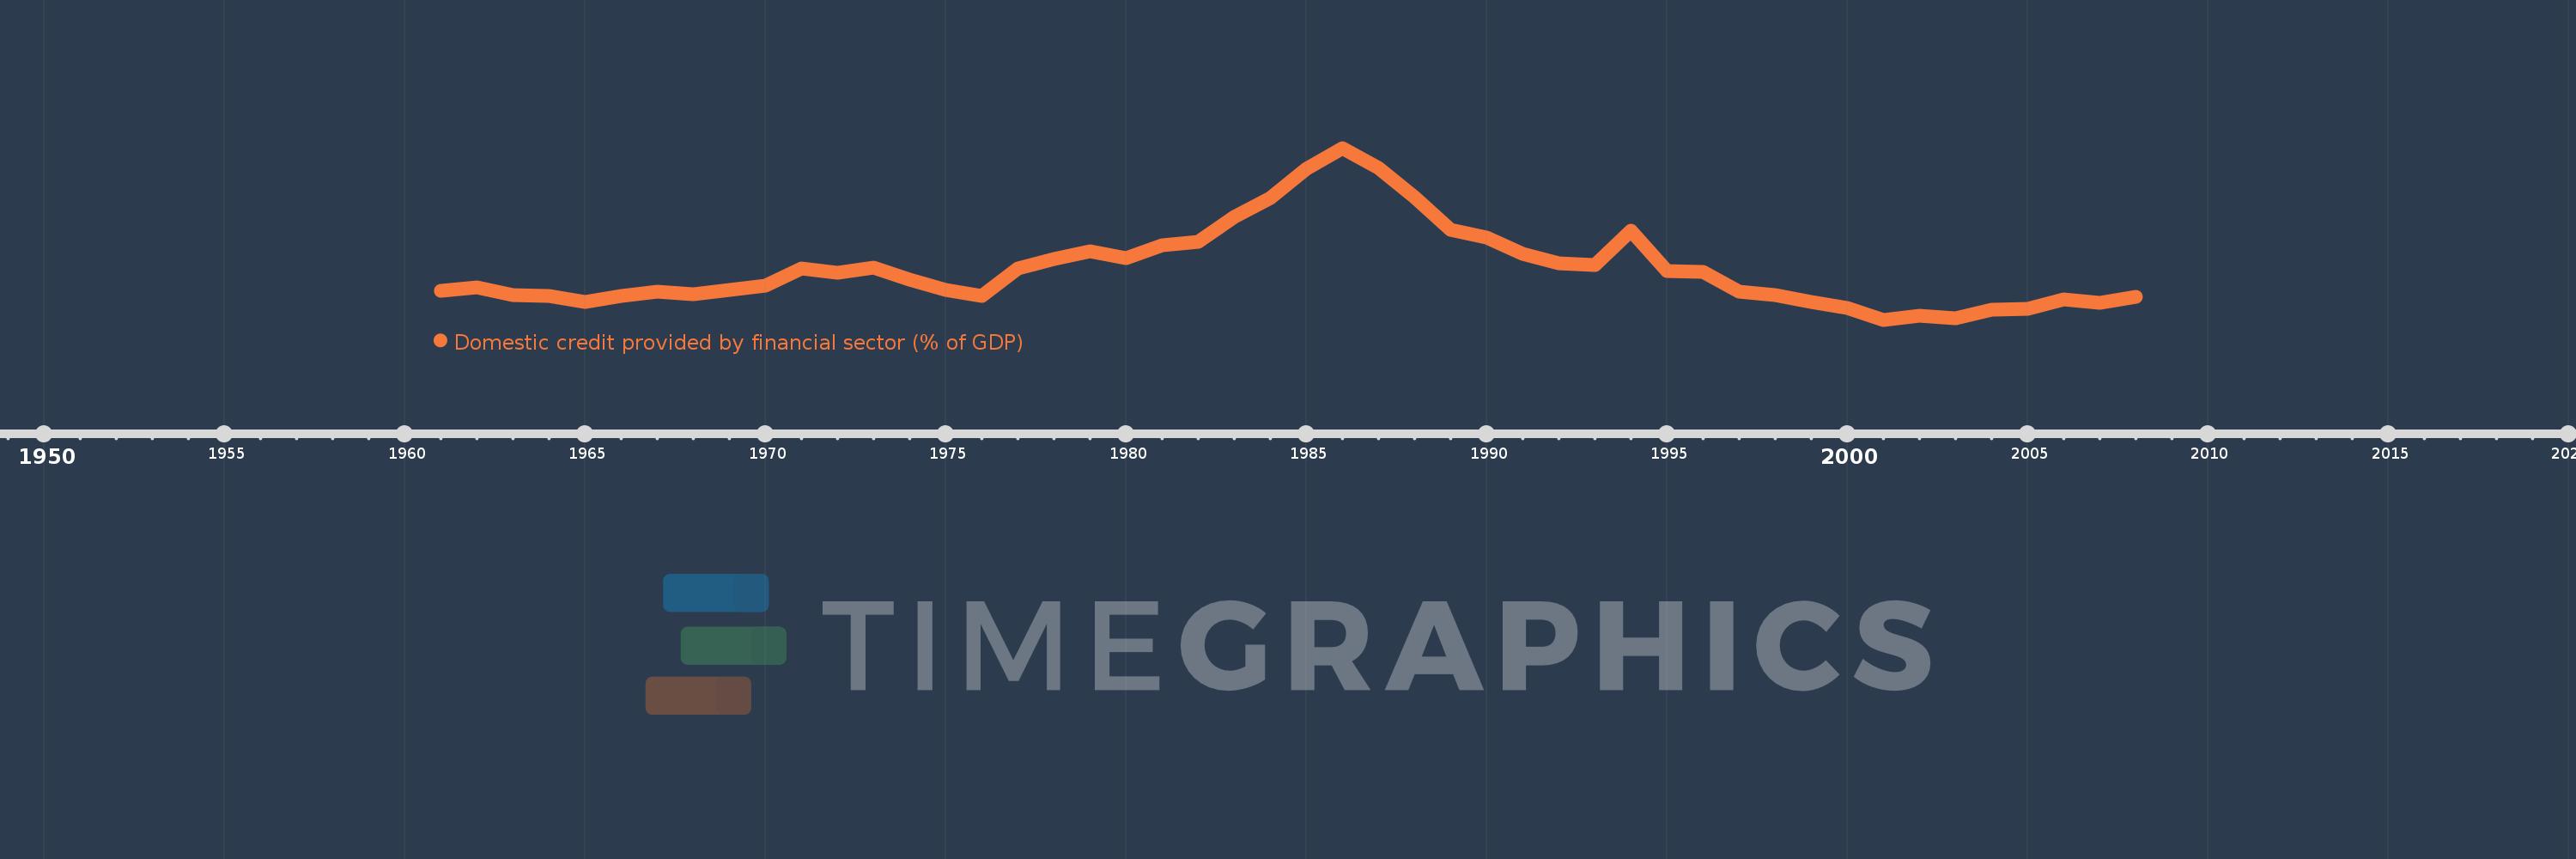
Domestic credit provided by financial sector (% of GDP)
2008,2007,2006,2005,2004,2003,2002,2001,2000,1999,1998,1997,1996,1995,1994,1993,1992,1991,1990,1989,1988,1987,1986,1985,1984,1983,1982,1981,1980,1979,1978,1977,1976,1975,1974,1973,1972,1971,1970,1969,1968,1967,1966,1965,1964,1963,1962,1961
This statistics in other country:
AfghanistanAlbaniaAlgeriaAngolaAntigua and BarbudaArab WorldArgentinaArmeniaArubaAustraliaAustriaAzerbaijanBahamas, TheBahrainBangladeshBarbadosBelarusBelgiumBelizeBeninBhutanBoliviaBosnia and HerzegovinaBotswanaBrazilBrunei DarussalamBulgariaBurkina FasoBurundiCabo VerdeCambodiaCameroonCanadaCaribbean small statesCentral African RepublicCentral Europe and the BalticsChadChileChinaColombiaComorosCongo, Dem. Rep.Congo, Rep.Costa RicaCote d'IvoireCroatiaCyprusCzech RepublicDenmarkDjiboutiDominicaDominican RepublicEarly-demographic dividendEast Asia & PacificEast Asia & Pacific (excluding high income)East Asia & Pacific (IDA & IBRD countries)EcuadorEgypt, Arab Rep.El SalvadorEquatorial GuineaEritreaEstoniaEthiopiaEuro areaEurope & Central AsiaEurope & Central Asia (excluding high income)Europe & Central Asia (IDA & IBRD countries)European UnionFijiFinlandFragile and conflict affected situationsFranceGabonGambia, TheGeorgiaGermanyGhanaGreeceGrenadaGuatemalaGuineaGuinea-BissauGuyanaHaitiHeavily indebted poor countries (HIPC)High incomeHondurasHong Kong SAR, ChinaHungaryIBRD onlyIcelandIDA & IBRD totalIDA blendIDA onlyIDA totalIndiaIndonesiaIran, Islamic Rep.IraqIrelandIsraelItalyJamaicaJapanJordanKazakhstanKenyaKorea, Rep.KosovoKuwaitKyrgyz RepublicLao PDRLate-demographic dividendLatin America & Caribbean Latin America & Caribbean (excluding high income)Latin America & the Caribbean (IDA & IBRD countries)LatviaLeast developed countries: UN classificationLebanonLesothoLiberiaLibyaLithuaniaLow & middle incomeLow incomeLower middle incomeLuxembourgMacao SAR, ChinaMacedonia, FYRMadagascarMalawiMalaysiaMaldivesMaliMaltaMauritaniaMauritiusMexicoMicronesia, Fed. Sts.Middle East & North AfricaMiddle East & North Africa (excluding high income)Middle East & North Africa (IDA & IBRD countries)Middle incomeMoldovaMongoliaMontenegroMoroccoMozambiqueMyanmarNamibiaNepalNetherlandsNew ZealandNicaraguaNigerNigeriaNorth AmericaNorwayOECD membersOmanOther small statesPacific island small statesPakistanPanamaPapua New GuineaParaguayPeruPhilippinesPolandPortugalPost-demographic dividendPre-demographic dividendQatarRomaniaRussian FederationRwandaSamoaSao Tome and PrincipeSaudi ArabiaSenegalSerbiaSeychellesSierra LeoneSingaporeSlovak RepublicSloveniaSmall statesSolomon IslandsSouth AfricaSouth AsiaSouth Asia (IDA & IBRD)South SudanSpainSri LankaSt. Kitts and NevisSt. LuciaSt. Vincent and the GrenadinesSub-Saharan Africa Sub-Saharan Africa (excluding high income)Sub-Saharan Africa (IDA & IBRD countries)SudanSurinameSwazilandSwedenSwitzerlandSyrian Arab RepublicTajikistanTanzaniaThailandTimor-LesteTogoTongaTrinidad and TobagoTunisiaTurkeyUgandaUkraineUnited Arab EmiratesUnited KingdomUnited StatesUpper middle incomeUruguayVanuatuVenezuela, RBVietnamWest Bank and GazaWorldYemen, Rep.ZambiaZimbabwe Timeline:
This timeline shows a graph from 1961 to 2008 of Syrian Arab Republic. No data until 1960. Number of actual observations by date: 48.
Source name:
World Development Indicators
Source organization:
International Monetary Fund, International Financial Statistics and data files, and World Bank and OECD GDP estimates.
Categories, topics:
Financial Sector
Last updated:
apr 23, 2017
Indicators value changes by year
Maximum:
106.867
jan 1, 1986
At the date of observation
Value
Absolute change
Change from previous value
jan 1, 1961
39.292
+39.292
0.0%
jan 1, 1962
40.777
+1.485
3.78%
jan 1, 1963
37.306
-3.471
-8.51%
jan 1, 1964
36.801
-0.505
-1.35%
jan 1, 1965
33.755
-3.046
-8.28%
jan 1, 1966
36.644
+2.889
8.56%
jan 1, 1967
38.914
+2.27
6.2%
jan 1, 1968
37.402
-1.513
-3.89%
jan 1, 1969
39.646
+2.245
6.0%
jan 1, 1970
41.466
+1.819
4.59%
jan 1, 1971
49.685
+8.219
19.82%
jan 1, 1972
47.664
-2.022
-4.07%
jan 1, 1973
50.233
+2.569
5.39%
jan 1, 1974
44.35
-5.883
-11.71%
jan 1, 1975
39.535
-4.815
-10.86%
jan 1, 1976
36.845
-2.69
-6.8%
jan 1, 1977
49.837
+12.991
35.26%
jan 1, 1978
54.136
+4.3
8.63%
jan 1, 1979
57.729
+3.593
6.64%
jan 1, 1980
54.577
-3.152
-5.46%
jan 1, 1981
60.894
+6.317
11.57%
jan 1, 1982
62.427
+1.532
2.52%
jan 1, 1983
74.006
+11.579
18.55%
jan 1, 1984
83.247
+9.241
12.49%
jan 1, 1985
96.963
+13.717
16.48%
jan 1, 1986
106.867
+9.904
10.21%
jan 1, 1987
97.278
-9.589
-8.97%
jan 1, 1988
83.534
-13.744
-14.13%
jan 1, 1989
68.221
-15.313
-18.33%
jan 1, 1990
64.472
-3.748
-5.49%
jan 1, 1991
56.611
-7.861
-12.19%
jan 1, 1992
52.292
-4.319
-7.63%
jan 1, 1993
51.47
-0.822
-1.57%
jan 1, 1994
67.672
+16.202
31.48%
jan 1, 1995
48.658
-19.014
-28.1%
jan 1, 1996
48.22
-0.438
-0.9%
jan 1, 1997
38.942
-9.278
-19.24%
jan 1, 1998
37.115
-1.827
-4.69%
jan 1, 1999
33.751
-3.364
-9.06%
jan 1, 2000
31.155
-2.596
-7.69%
jan 1, 2001
25.49
-5.665
-18.18%
jan 1, 2002
27.467
+1.977
7.75%
jan 1, 2003
26.307
-1.16
-4.22%
jan 1, 2004
30.203
+3.896
14.81%
jan 1, 2005
30.555
+0.352
1.17%
jan 1, 2006
35.263
+4.708
15.41%
jan 1, 2007
33.582
-1.68
-4.76%
jan 1, 2008
36.203
+2.621
7.8%
Ranking of countries by current statistics by years


Comments: