29
/
en
AIzaSyAYiBZKx7MnpbEhh9jyipgxe19OcubqV5w
April 1, 2024
57988
South Asia (IDA & IBRD)
TSA
false
2
1
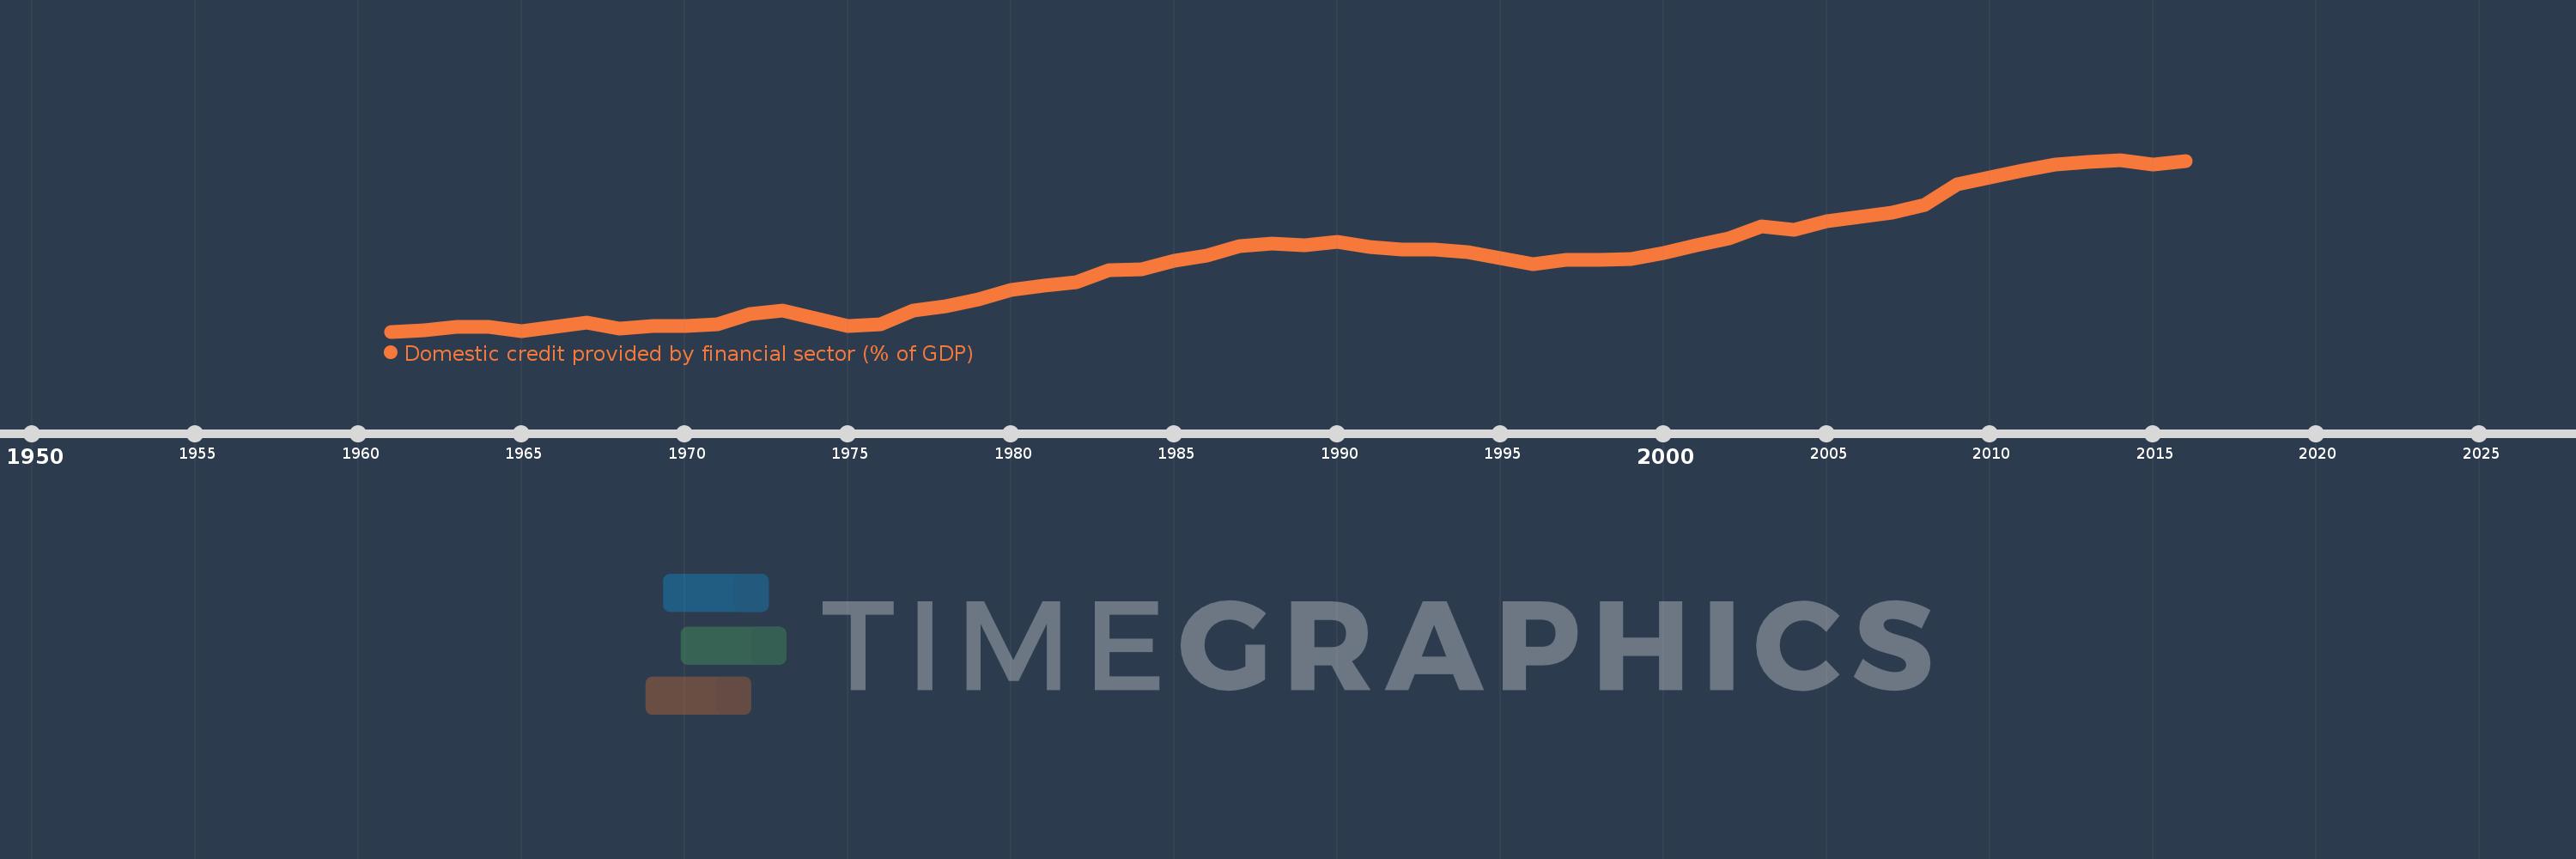
Domestic credit provided by financial sector (% of GDP)
2016,2015,2014,2013,2012,2011,2010,2009,2008,2007,2006,2005,2004,2003,2002,2001,2000,1999,1998,1997,1996,1995,1994,1993,1992,1991,1990,1989,1988,1987,1986,1985,1984,1983,1982,1981,1980,1979,1978,1977,1976,1975,1974,1973,1972,1971,1970,1969,1968,1967,1966,1965,1964,1963,1962,1961
This statistics in other country:
AfghanistanAlbaniaAlgeriaAngolaAntigua and BarbudaArab WorldArgentinaArmeniaArubaAustraliaAustriaAzerbaijanBahamas, TheBahrainBangladeshBarbadosBelarusBelgiumBelizeBeninBhutanBoliviaBosnia and HerzegovinaBotswanaBrazilBrunei DarussalamBulgariaBurkina FasoBurundiCabo VerdeCambodiaCameroonCanadaCaribbean small statesCentral African RepublicCentral Europe and the BalticsChadChileChinaColombiaComorosCongo, Dem. Rep.Congo, Rep.Costa RicaCote d'IvoireCroatiaCyprusCzech RepublicDenmarkDjiboutiDominicaDominican RepublicEarly-demographic dividendEast Asia & PacificEast Asia & Pacific (excluding high income)East Asia & Pacific (IDA & IBRD countries)EcuadorEgypt, Arab Rep.El SalvadorEquatorial GuineaEritreaEstoniaEthiopiaEuro areaEurope & Central AsiaEurope & Central Asia (excluding high income)Europe & Central Asia (IDA & IBRD countries)European UnionFijiFinlandFragile and conflict affected situationsFranceGabonGambia, TheGeorgiaGermanyGhanaGreeceGrenadaGuatemalaGuineaGuinea-BissauGuyanaHaitiHeavily indebted poor countries (HIPC)High incomeHondurasHong Kong SAR, ChinaHungaryIBRD onlyIcelandIDA & IBRD totalIDA blendIDA onlyIDA totalIndiaIndonesiaIran, Islamic Rep.IraqIrelandIsraelItalyJamaicaJapanJordanKazakhstanKenyaKorea, Rep.KosovoKuwaitKyrgyz RepublicLao PDRLate-demographic dividendLatin America & Caribbean Latin America & Caribbean (excluding high income)Latin America & the Caribbean (IDA & IBRD countries)LatviaLeast developed countries: UN classificationLebanonLesothoLiberiaLibyaLithuaniaLow & middle incomeLow incomeLower middle incomeLuxembourgMacao SAR, ChinaMacedonia, FYRMadagascarMalawiMalaysiaMaldivesMaliMaltaMauritaniaMauritiusMexicoMicronesia, Fed. Sts.Middle East & North AfricaMiddle East & North Africa (excluding high income)Middle East & North Africa (IDA & IBRD countries)Middle incomeMoldovaMongoliaMontenegroMoroccoMozambiqueMyanmarNamibiaNepalNetherlandsNew ZealandNicaraguaNigerNigeriaNorth AmericaNorwayOECD membersOmanOther small statesPacific island small statesPakistanPanamaPapua New GuineaParaguayPeruPhilippinesPolandPortugalPost-demographic dividendPre-demographic dividendQatarRomaniaRussian FederationRwandaSamoaSao Tome and PrincipeSaudi ArabiaSenegalSerbiaSeychellesSierra LeoneSingaporeSlovak RepublicSloveniaSmall statesSolomon IslandsSouth AfricaSouth AsiaSouth Asia (IDA & IBRD)South SudanSpainSri LankaSt. Kitts and NevisSt. LuciaSt. Vincent and the GrenadinesSub-Saharan Africa Sub-Saharan Africa (excluding high income)Sub-Saharan Africa (IDA & IBRD countries)SudanSurinameSwazilandSwedenSwitzerlandSyrian Arab RepublicTajikistanTanzaniaThailandTimor-LesteTogoTongaTrinidad and TobagoTunisiaTurkeyUgandaUkraineUnited Arab EmiratesUnited KingdomUnited StatesUpper middle incomeUruguayVanuatuVenezuela, RBVietnamWest Bank and GazaWorldYemen, Rep.ZambiaZimbabwe Timeline:
This timeline shows a graph from 1961 to 2016 of South Asia (IDA & IBRD). No data until 1960. Number of actual observations by date: 56.
Source name:
World Development Indicators
Source organization:
International Monetary Fund, International Financial Statistics and data files, and World Bank and OECD GDP estimates.
Categories, topics:
Financial Sector
Last updated:
apr 23, 2017
Indicators value changes by year
Minimum:
23.243
jan 1, 1961
Maximum:
72.222
jan 1, 2014
At the date of observation
Value
Absolute change
Change from previous value
jan 1, 1961
23.243
+23.243
0.0%
jan 1, 1962
23.681
+0.438
1.88%
jan 1, 1963
24.679
+0.998
4.21%
jan 1, 1964
24.55
-0.129
-0.52%
jan 1, 1965
23.434
-1.116
-4.55%
jan 1, 1966
24.688
+1.254
5.35%
jan 1, 1967
25.699
+1.012
4.1%
jan 1, 1968
24.181
-1.518
-5.91%
jan 1, 1969
24.756
+0.575
2.38%
jan 1, 1970
24.742
-0.014
-0.06%
jan 1, 1971
25.409
+0.667
2.7%
jan 1, 1972
28.225
+2.816
11.08%
jan 1, 1973
29.298
+1.072
3.8%
jan 1, 1974
27.157
-2.141
-7.31%
jan 1, 1975
24.777
-2.38
-8.76%
jan 1, 1976
25.229
+0.452
1.82%
jan 1, 1977
29.31
+4.081
16.18%
jan 1, 1978
30.524
+1.214
4.14%
jan 1, 1979
32.479
+1.955
6.4%
jan 1, 1980
35.156
+2.677
8.24%
jan 1, 1981
36.342
+1.186
3.37%
jan 1, 1982
37.398
+1.056
2.91%
jan 1, 1983
40.865
+3.467
9.27%
jan 1, 1984
40.993
+0.128
0.31%
jan 1, 1985
43.422
+2.429
5.93%
jan 1, 1986
45.028
+1.605
3.7%
jan 1, 1987
47.682
+2.654
5.89%
jan 1, 1988
48.354
+0.673
1.41%
jan 1, 1989
47.778
-0.576
-1.19%
jan 1, 1990
48.743
+0.966
2.02%
jan 1, 1991
47.403
-1.34
-2.75%
jan 1, 1992
46.514
-0.889
-1.88%
jan 1, 1993
46.709
+0.196
0.42%
jan 1, 1994
45.853
-0.857
-1.83%
jan 1, 1995
44.196
-1.657
-3.61%
jan 1, 1996
42.451
-1.745
-3.95%
jan 1, 1997
43.581
+1.131
2.66%
jan 1, 1998
43.665
+0.083
0.19%
jan 1, 1999
43.906
+0.241
0.55%
jan 1, 2000
45.704
+1.798
4.1%
jan 1, 2001
47.932
+2.228
4.87%
jan 1, 2002
49.862
+1.93
4.03%
jan 1, 2003
53.187
+3.325
6.67%
jan 1, 2004
52.274
-0.913
-1.72%
jan 1, 2005
54.612
+2.338
4.47%
jan 1, 2006
55.901
+1.289
2.36%
jan 1, 2007
57.223
+1.322
2.36%
jan 1, 2008
59.343
+2.12
3.7%
jan 1, 2009
65.361
+6.018
10.14%
jan 1, 2010
67.147
+1.786
2.73%
jan 1, 2011
69.133
+1.987
2.96%
jan 1, 2012
70.796
+1.663
2.41%
jan 1, 2013
71.576
+0.78
1.1%
jan 1, 2014
72.222
+0.646
0.9%
jan 1, 2015
70.906
-1.315
-1.82%
jan 1, 2016
71.756
+0.849
1.2%
Ranking of countries by current statistics by years


Comments: