29
/
en
AIzaSyAYiBZKx7MnpbEhh9jyipgxe19OcubqV5w
April 1, 2024
272105
Uganda
UGA
true
2
1
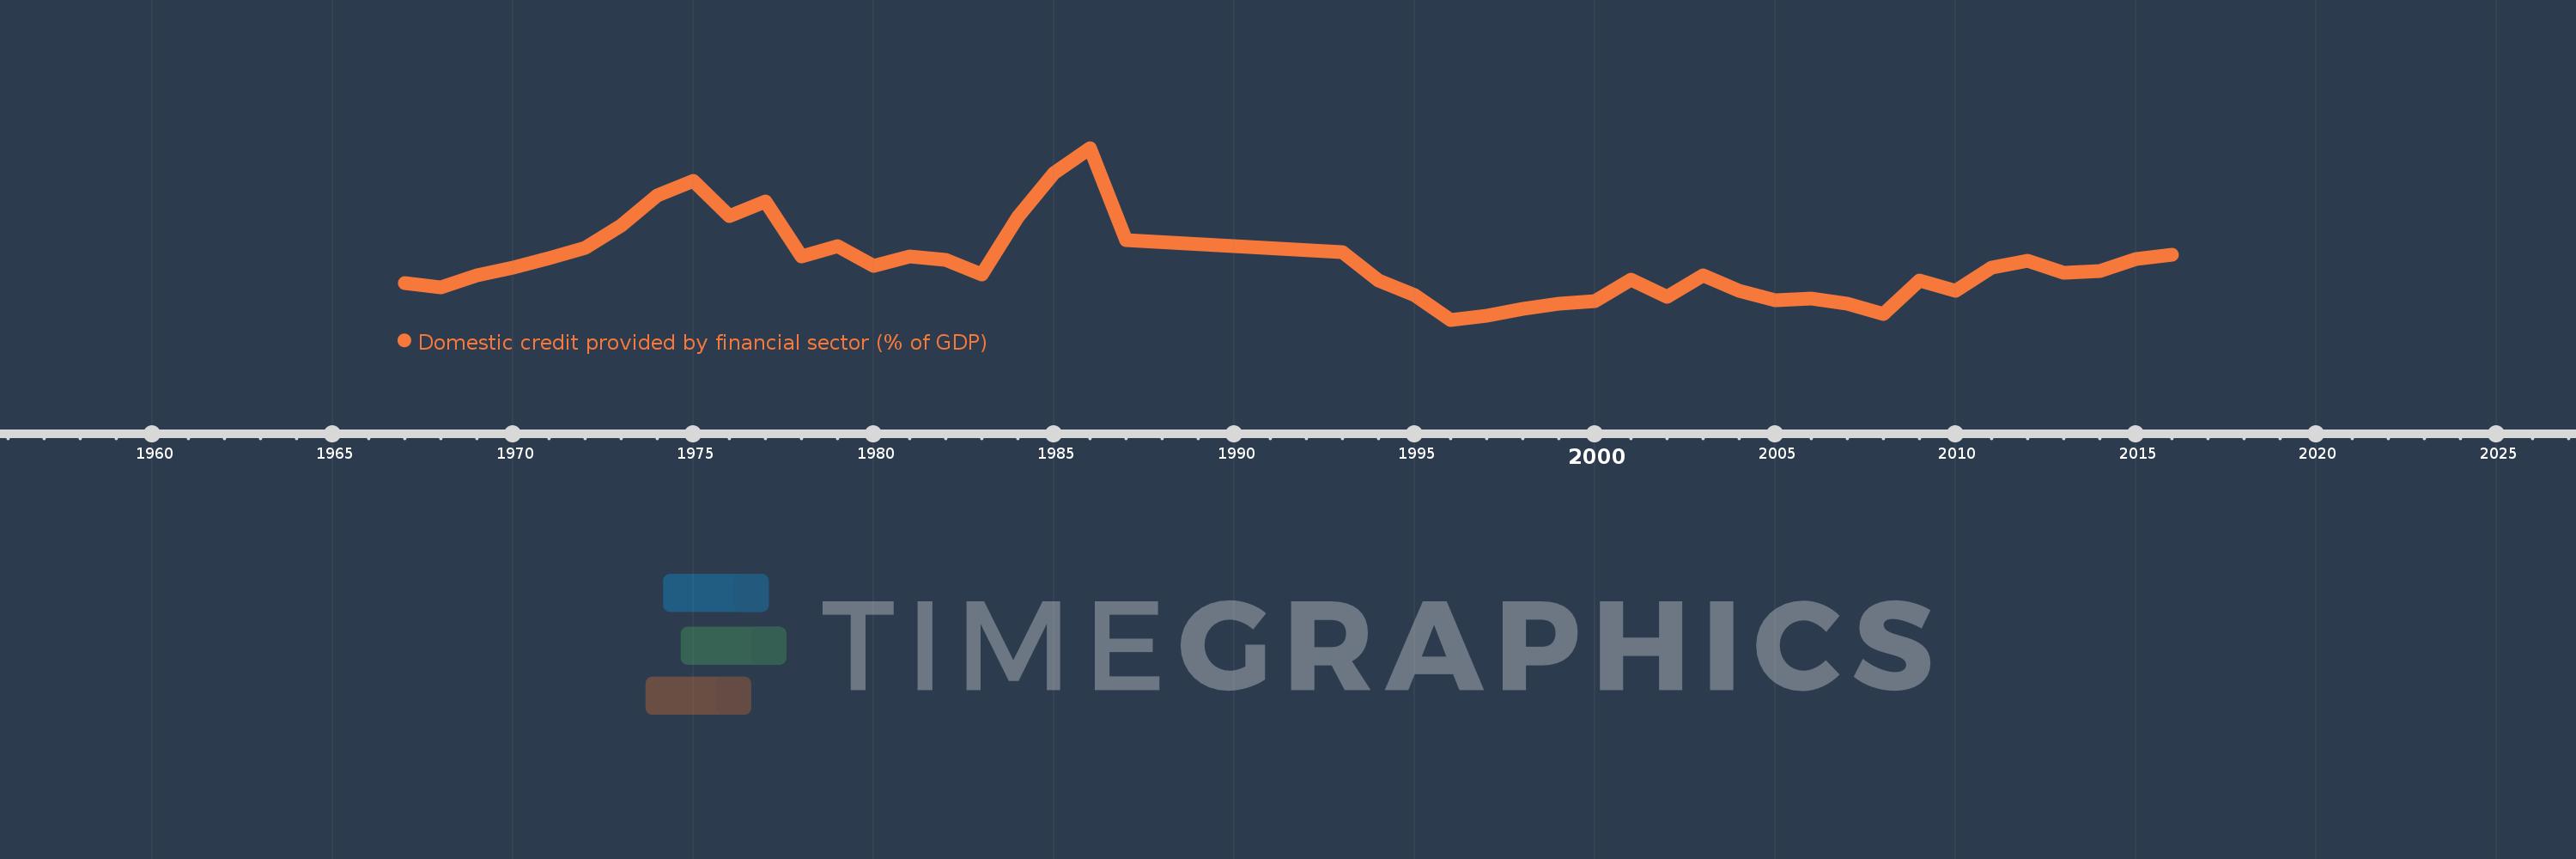
Domestic credit provided by financial sector (% of GDP)
2016,2015,2014,2013,2012,2011,2010,2009,2008,2007,2006,2005,2004,2003,2002,2001,2000,1999,1998,1997,1996,1995,1994,1993,1987,1986,1985,1984,1983,1982,1981,1980,1979,1978,1977,1976,1975,1974,1973,1972,1971,1970,1969,1968,1967
This statistics in other country:
AfghanistanAlbaniaAlgeriaAngolaAntigua and BarbudaArab WorldArgentinaArmeniaArubaAustraliaAustriaAzerbaijanBahamas, TheBahrainBangladeshBarbadosBelarusBelgiumBelizeBeninBhutanBoliviaBosnia and HerzegovinaBotswanaBrazilBrunei DarussalamBulgariaBurkina FasoBurundiCabo VerdeCambodiaCameroonCanadaCaribbean small statesCentral African RepublicCentral Europe and the BalticsChadChileChinaColombiaComorosCongo, Dem. Rep.Congo, Rep.Costa RicaCote d'IvoireCroatiaCyprusCzech RepublicDenmarkDjiboutiDominicaDominican RepublicEarly-demographic dividendEast Asia & PacificEast Asia & Pacific (excluding high income)East Asia & Pacific (IDA & IBRD countries)EcuadorEgypt, Arab Rep.El SalvadorEquatorial GuineaEritreaEstoniaEthiopiaEuro areaEurope & Central AsiaEurope & Central Asia (excluding high income)Europe & Central Asia (IDA & IBRD countries)European UnionFijiFinlandFragile and conflict affected situationsFranceGabonGambia, TheGeorgiaGermanyGhanaGreeceGrenadaGuatemalaGuineaGuinea-BissauGuyanaHaitiHeavily indebted poor countries (HIPC)High incomeHondurasHong Kong SAR, ChinaHungaryIBRD onlyIcelandIDA & IBRD totalIDA blendIDA onlyIDA totalIndiaIndonesiaIran, Islamic Rep.IraqIrelandIsraelItalyJamaicaJapanJordanKazakhstanKenyaKorea, Rep.KosovoKuwaitKyrgyz RepublicLao PDRLate-demographic dividendLatin America & Caribbean Latin America & Caribbean (excluding high income)Latin America & the Caribbean (IDA & IBRD countries)LatviaLeast developed countries: UN classificationLebanonLesothoLiberiaLibyaLithuaniaLow & middle incomeLow incomeLower middle incomeLuxembourgMacao SAR, ChinaMacedonia, FYRMadagascarMalawiMalaysiaMaldivesMaliMaltaMauritaniaMauritiusMexicoMicronesia, Fed. Sts.Middle East & North AfricaMiddle East & North Africa (excluding high income)Middle East & North Africa (IDA & IBRD countries)Middle incomeMoldovaMongoliaMontenegroMoroccoMozambiqueMyanmarNamibiaNepalNetherlandsNew ZealandNicaraguaNigerNigeriaNorth AmericaNorwayOECD membersOmanOther small statesPacific island small statesPakistanPanamaPapua New GuineaParaguayPeruPhilippinesPolandPortugalPost-demographic dividendPre-demographic dividendQatarRomaniaRussian FederationRwandaSamoaSao Tome and PrincipeSaudi ArabiaSenegalSerbiaSeychellesSierra LeoneSingaporeSlovak RepublicSloveniaSmall statesSolomon IslandsSouth AfricaSouth AsiaSouth Asia (IDA & IBRD)South SudanSpainSri LankaSt. Kitts and NevisSt. LuciaSt. Vincent and the GrenadinesSub-Saharan Africa Sub-Saharan Africa (excluding high income)Sub-Saharan Africa (IDA & IBRD countries)SudanSurinameSwazilandSwedenSwitzerlandSyrian Arab RepublicTajikistanTanzaniaThailandTimor-LesteTogoTongaTrinidad and TobagoTunisiaTurkeyUgandaUkraineUnited Arab EmiratesUnited KingdomUnited StatesUpper middle incomeUruguayVanuatuVenezuela, RBVietnamWest Bank and GazaWorldYemen, Rep.ZambiaZimbabwe Timeline:
This timeline shows a graph from 1967 to 2016 of Uganda. No data until 1966. Number of actual observations by date: 45.
Source name:
World Development Indicators
Source organization:
International Monetary Fund, International Financial Statistics and data files, and World Bank and OECD GDP estimates.
Categories, topics:
Financial Sector
Last updated:
apr 23, 2017
Indicators value changes by year
Maximum:
38.205
jan 1, 1986
At the date of observation
Value
Absolute change
Change from previous value
jan 1, 1967
11.558
+11.558
0.0%
jan 1, 1968
10.812
-0.746
-6.46%
jan 1, 1969
13.09
+2.278
21.07%
jan 1, 1970
14.582
+1.492
11.4%
jan 1, 1971
16.54
+1.958
13.43%
jan 1, 1972
18.567
+2.027
12.26%
jan 1, 1973
22.935
+4.369
23.53%
jan 1, 1974
28.785
+5.85
25.51%
jan 1, 1975
31.737
+2.952
10.25%
jan 1, 1976
24.762
-6.975
-21.98%
jan 1, 1977
27.659
+2.897
11.7%
jan 1, 1978
16.844
-10.814
-39.1%
jan 1, 1979
18.879
+2.035
12.08%
jan 1, 1980
15.025
-3.854
-20.42%
jan 1, 1981
16.924
+1.899
12.64%
jan 1, 1982
16.086
-0.838
-4.95%
jan 1, 1983
13.368
-2.718
-16.9%
jan 1, 1984
24.584
+11.216
83.9%
jan 1, 1985
33.243
+8.659
35.22%
jan 1, 1986
38.205
+4.962
14.93%
jan 1, 1987
19.981
-18.224
-47.7%
jan 1, 1993
17.751
-2.231
-11.16%
jan 1, 1994
12.104
-5.647
-31.81%
jan 1, 1995
9.232
-2.872
-23.72%
jan 1, 1996
4.378
-4.854
-52.58%
jan 1, 1997
5.151
+0.772
17.64%
jan 1, 1998
6.565
+1.415
27.47%
jan 1, 1999
7.526
+0.961
14.64%
jan 1, 2000
8.044
+0.517
6.87%
jan 1, 2001
12.203
+4.16
51.71%
jan 1, 2002
8.861
-3.342
-27.39%
jan 1, 2003
13.205
+4.344
49.03%
jan 1, 2004
10.088
-3.118
-23.61%
jan 1, 2005
8.22
-1.868
-18.51%
jan 1, 2006
8.636
+0.416
5.06%
jan 1, 2007
7.511
-1.125
-13.03%
jan 1, 2008
5.492
-2.018
-26.87%
jan 1, 2009
12.122
+6.629
120.7%
jan 1, 2010
10.133
-1.989
-16.41%
jan 1, 2011
14.573
+4.44
43.81%
jan 1, 2012
15.956
+1.383
9.49%
jan 1, 2013
13.593
-2.363
-14.81%
jan 1, 2014
13.987
+0.395
2.91%
jan 1, 2015
16.334
+2.347
16.78%
jan 1, 2016
17.12
+0.786
4.81%
Ranking of countries by current statistics by years


Comments: