29
/
en
AIzaSyAYiBZKx7MnpbEhh9jyipgxe19OcubqV5w
April 1, 2024
157135
Iran, Islamic Rep.
IRN
true
2
1
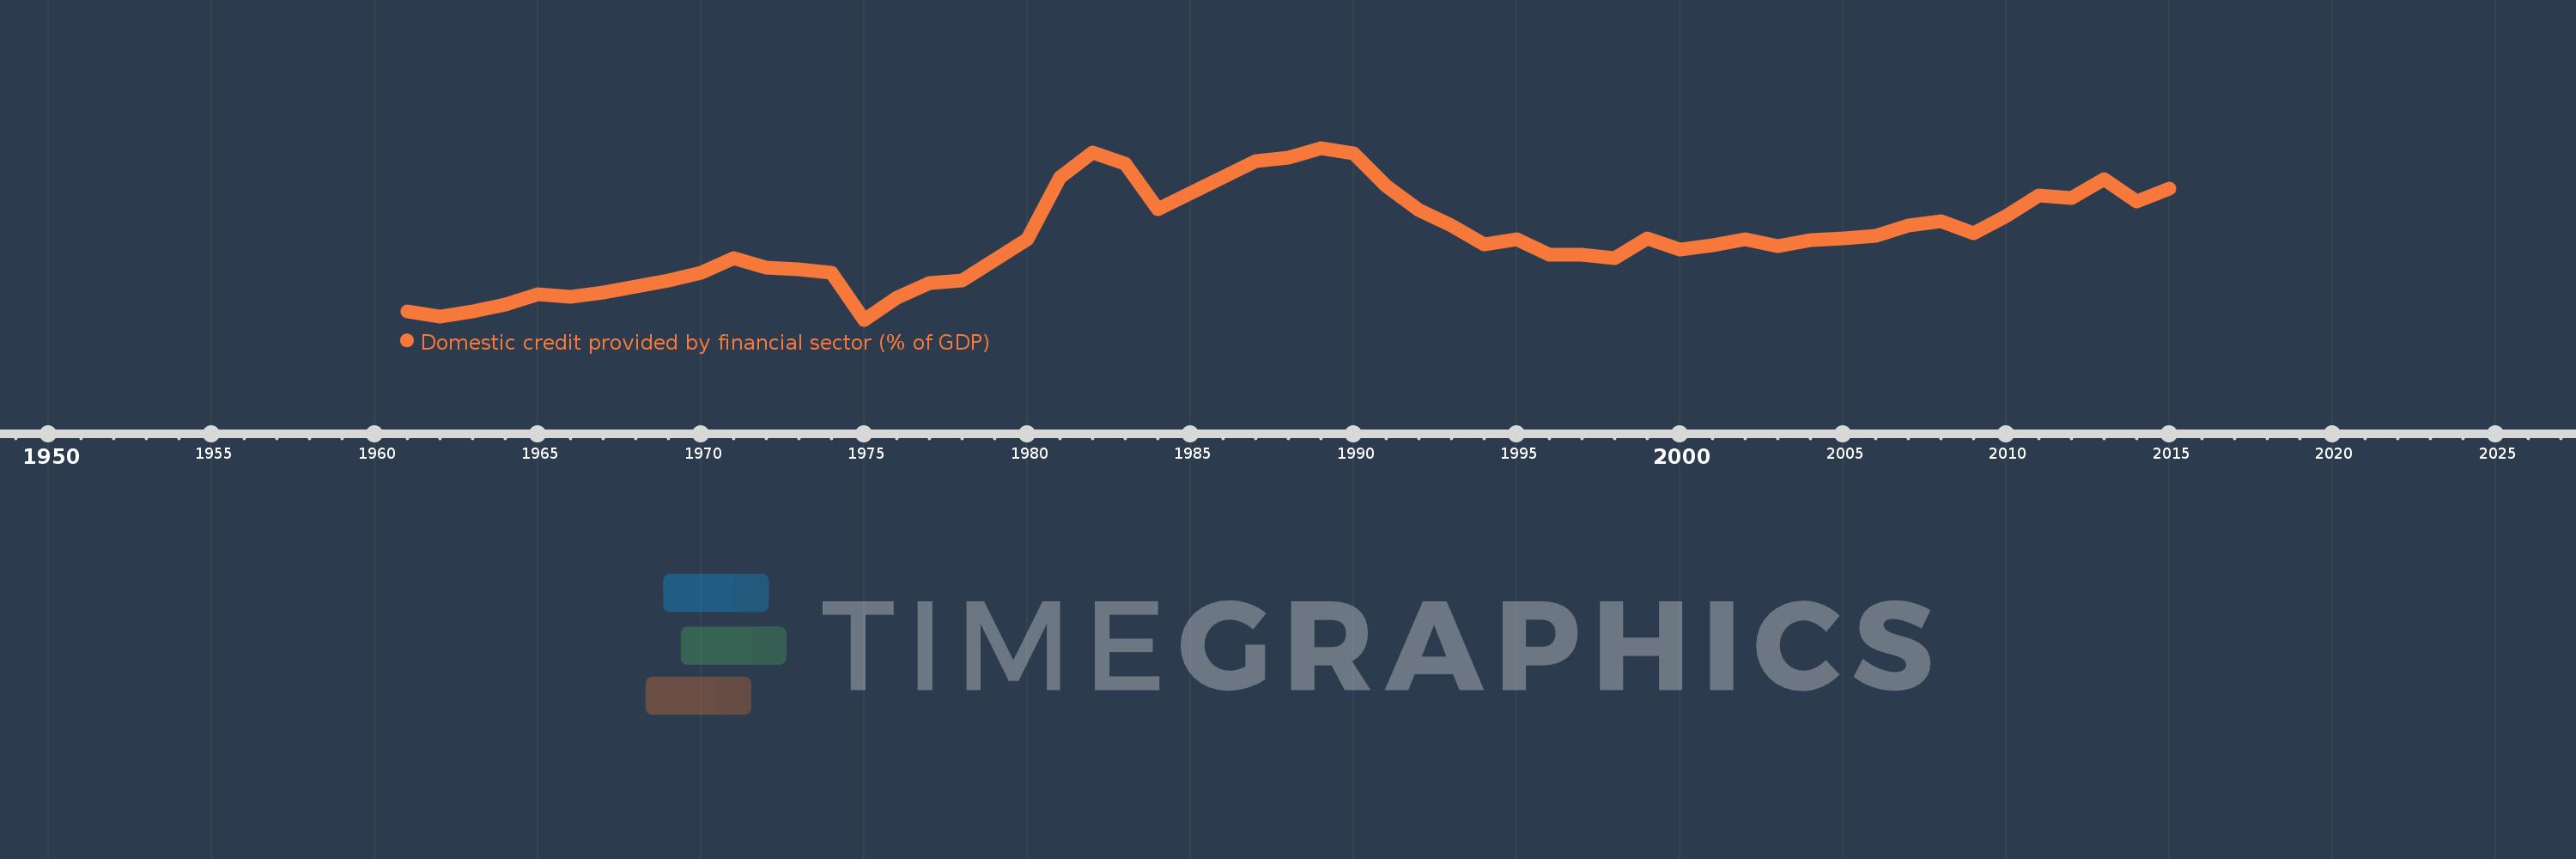
Domestic credit provided by financial sector (% of GDP)
2015,2014,2013,2012,2011,2010,2009,2008,2007,2006,2005,2004,2003,2002,2001,2000,1999,1998,1997,1996,1995,1994,1993,1992,1991,1990,1989,1988,1987,1984,1983,1982,1981,1980,1978,1977,1976,1975,1974,1973,1972,1971,1970,1969,1968,1967,1966,1965,1964,1963,1962,1961
This statistics in other country:
AfghanistanAlbaniaAlgeriaAngolaAntigua and BarbudaArab WorldArgentinaArmeniaArubaAustraliaAustriaAzerbaijanBahamas, TheBahrainBangladeshBarbadosBelarusBelgiumBelizeBeninBhutanBoliviaBosnia and HerzegovinaBotswanaBrazilBrunei DarussalamBulgariaBurkina FasoBurundiCabo VerdeCambodiaCameroonCanadaCaribbean small statesCentral African RepublicCentral Europe and the BalticsChadChileChinaColombiaComorosCongo, Dem. Rep.Congo, Rep.Costa RicaCote d'IvoireCroatiaCyprusCzech RepublicDenmarkDjiboutiDominicaDominican RepublicEarly-demographic dividendEast Asia & PacificEast Asia & Pacific (excluding high income)East Asia & Pacific (IDA & IBRD countries)EcuadorEgypt, Arab Rep.El SalvadorEquatorial GuineaEritreaEstoniaEthiopiaEuro areaEurope & Central AsiaEurope & Central Asia (excluding high income)Europe & Central Asia (IDA & IBRD countries)European UnionFijiFinlandFragile and conflict affected situationsFranceGabonGambia, TheGeorgiaGermanyGhanaGreeceGrenadaGuatemalaGuineaGuinea-BissauGuyanaHaitiHeavily indebted poor countries (HIPC)High incomeHondurasHong Kong SAR, ChinaHungaryIBRD onlyIcelandIDA & IBRD totalIDA blendIDA onlyIDA totalIndiaIndonesiaIran, Islamic Rep.IraqIrelandIsraelItalyJamaicaJapanJordanKazakhstanKenyaKorea, Rep.KosovoKuwaitKyrgyz RepublicLao PDRLate-demographic dividendLatin America & Caribbean Latin America & Caribbean (excluding high income)Latin America & the Caribbean (IDA & IBRD countries)LatviaLeast developed countries: UN classificationLebanonLesothoLiberiaLibyaLithuaniaLow & middle incomeLow incomeLower middle incomeLuxembourgMacao SAR, ChinaMacedonia, FYRMadagascarMalawiMalaysiaMaldivesMaliMaltaMauritaniaMauritiusMexicoMicronesia, Fed. Sts.Middle East & North AfricaMiddle East & North Africa (excluding high income)Middle East & North Africa (IDA & IBRD countries)Middle incomeMoldovaMongoliaMontenegroMoroccoMozambiqueMyanmarNamibiaNepalNetherlandsNew ZealandNicaraguaNigerNigeriaNorth AmericaNorwayOECD membersOmanOther small statesPacific island small statesPakistanPanamaPapua New GuineaParaguayPeruPhilippinesPolandPortugalPost-demographic dividendPre-demographic dividendQatarRomaniaRussian FederationRwandaSamoaSao Tome and PrincipeSaudi ArabiaSenegalSerbiaSeychellesSierra LeoneSingaporeSlovak RepublicSloveniaSmall statesSolomon IslandsSouth AfricaSouth AsiaSouth Asia (IDA & IBRD)South SudanSpainSri LankaSt. Kitts and NevisSt. LuciaSt. Vincent and the GrenadinesSub-Saharan Africa Sub-Saharan Africa (excluding high income)Sub-Saharan Africa (IDA & IBRD countries)SudanSurinameSwazilandSwedenSwitzerlandSyrian Arab RepublicTajikistanTanzaniaThailandTimor-LesteTogoTongaTrinidad and TobagoTunisiaTurkeyUgandaUkraineUnited Arab EmiratesUnited KingdomUnited StatesUpper middle incomeUruguayVanuatuVenezuela, RBVietnamWest Bank and GazaWorldYemen, Rep.ZambiaZimbabwe Timeline:
This timeline shows a graph from 1961 to 2015 of Iran, Islamic Rep.. No data until 1960. Number of actual observations by date: 52.
Source name:
World Development Indicators
Source organization:
International Monetary Fund, International Financial Statistics and data files, and World Bank and OECD GDP estimates.
Categories, topics:
Financial Sector
Last updated:
apr 23, 2017
Indicators value changes by year
Minimum:
16.633
jan 1, 1975
Maximum:
72.176
jan 1, 1989
At the date of observation
Value
Absolute change
Change from previous value
jan 1, 1961
19.224
+19.224
0.0%
jan 1, 1962
17.666
-1.559
-8.11%
jan 1, 1963
19.357
+1.691
9.57%
jan 1, 1964
21.594
+2.237
11.56%
jan 1, 1965
24.884
+3.29
15.24%
jan 1, 1966
24.167
-0.718
-2.88%
jan 1, 1967
25.407
+1.241
5.13%
jan 1, 1968
27.511
+2.103
8.28%
jan 1, 1969
29.308
+1.797
6.53%
jan 1, 1970
31.922
+2.615
8.92%
jan 1, 1971
36.513
+4.591
14.38%
jan 1, 1972
33.494
-3.019
-8.27%
jan 1, 1973
32.848
-0.646
-1.93%
jan 1, 1974
31.835
-1.013
-3.08%
jan 1, 1975
16.633
-15.203
-47.75%
jan 1, 1976
23.748
+7.116
42.78%
jan 1, 1977
28.494
+4.746
19.98%
jan 1, 1978
29.196
+0.702
2.46%
jan 1, 1980
42.758
+13.562
46.45%
jan 1, 1981
62.712
+19.955
46.67%
jan 1, 1982
70.735
+8.023
12.79%
jan 1, 1983
67.049
-3.687
-5.21%
jan 1, 1984
52.359
-14.69
-21.91%
jan 1, 1987
67.936
+15.577
29.75%
jan 1, 1988
69.073
+1.138
1.67%
jan 1, 1989
72.176
+3.102
4.49%
jan 1, 1990
70.499
-1.676
-2.32%
jan 1, 1991
59.892
-10.608
-15.05%
jan 1, 1992
52.114
-7.777
-12.99%
jan 1, 1993
47.195
-4.919
-9.44%
jan 1, 1994
40.878
-6.317
-13.39%
jan 1, 1995
42.57
+1.692
4.14%
jan 1, 1996
37.709
-4.862
-11.42%
jan 1, 1997
37.558
-0.151
-0.4%
jan 1, 1998
36.48
-1.077
-2.87%
jan 1, 1999
42.919
+6.439
17.65%
jan 1, 2000
39.418
-3.501
-8.16%
jan 1, 2001
40.645
+1.226
3.11%
jan 1, 2002
42.754
+2.109
5.19%
jan 1, 2003
40.323
-2.43
-5.68%
jan 1, 2004
42.379
+2.055
5.1%
jan 1, 2005
43.04
+0.662
1.56%
jan 1, 2006
43.717
+0.677
1.57%
jan 1, 2007
47.088
+3.37
7.71%
jan 1, 2008
48.408
+1.32
2.8%
jan 1, 2009
44.505
-3.902
-8.06%
jan 1, 2010
50.098
+5.592
12.57%
jan 1, 2011
56.947
+6.85
13.67%
jan 1, 2012
55.962
-0.985
-1.73%
jan 1, 2013
62.151
+6.189
11.06%
jan 1, 2014
54.931
-7.219
-11.62%
jan 1, 2015
58.97
+4.038
7.35%
Ranking of countries by current statistics by years


Comments: