29
/
en
AIzaSyAYiBZKx7MnpbEhh9jyipgxe19OcubqV5w
April 1, 2024
118773
Denmark
DNK
true
2
1
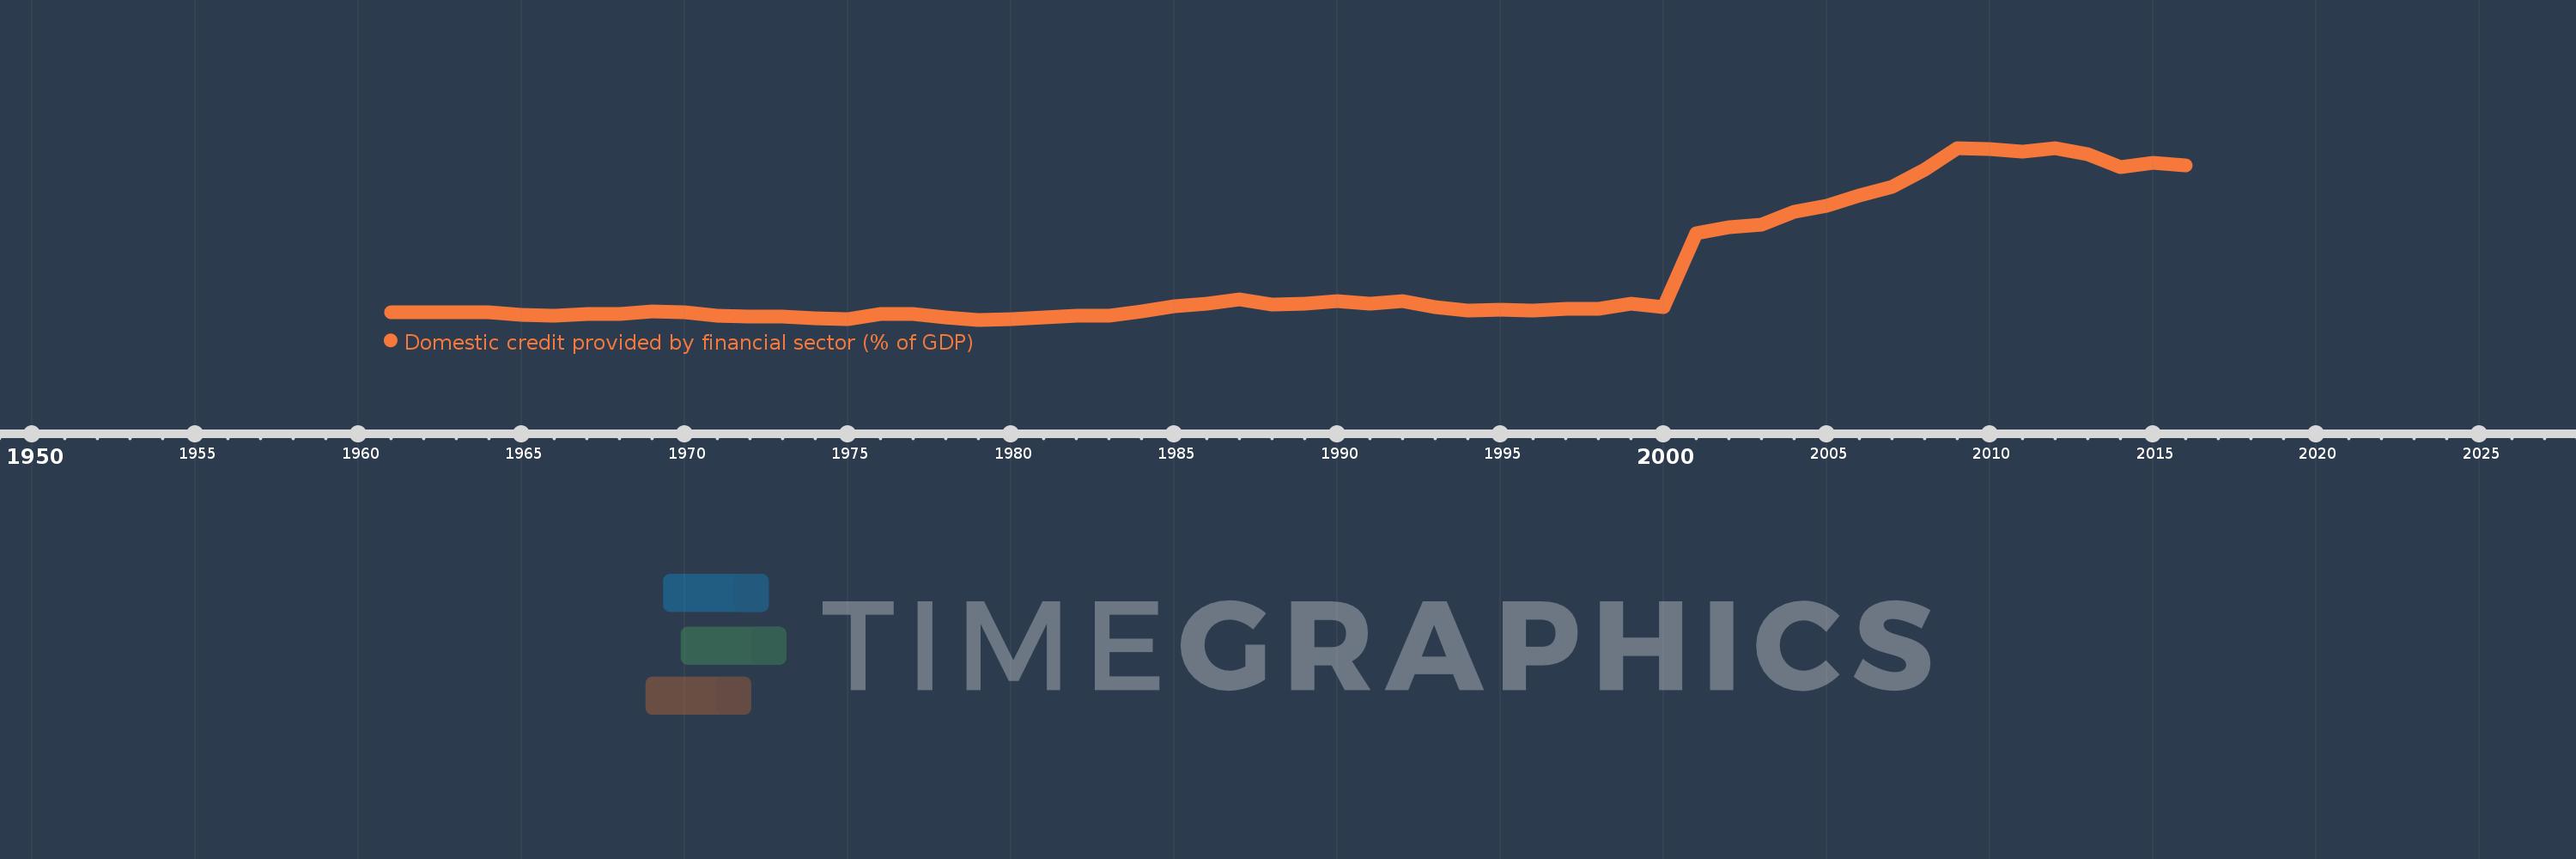
Domestic credit provided by financial sector (% of GDP)
2016,2015,2014,2013,2012,2011,2010,2009,2008,2007,2006,2005,2004,2003,2002,2001,2000,1999,1998,1997,1996,1995,1994,1993,1992,1991,1990,1989,1988,1987,1986,1985,1984,1983,1982,1981,1980,1979,1978,1977,1976,1975,1974,1973,1972,1971,1970,1969,1968,1967,1966,1965,1964,1963,1962,1961
This statistics in other country:
AfghanistanAlbaniaAlgeriaAngolaAntigua and BarbudaArab WorldArgentinaArmeniaArubaAustraliaAustriaAzerbaijanBahamas, TheBahrainBangladeshBarbadosBelarusBelgiumBelizeBeninBhutanBoliviaBosnia and HerzegovinaBotswanaBrazilBrunei DarussalamBulgariaBurkina FasoBurundiCabo VerdeCambodiaCameroonCanadaCaribbean small statesCentral African RepublicCentral Europe and the BalticsChadChileChinaColombiaComorosCongo, Dem. Rep.Congo, Rep.Costa RicaCote d'IvoireCroatiaCyprusCzech RepublicDenmarkDjiboutiDominicaDominican RepublicEarly-demographic dividendEast Asia & PacificEast Asia & Pacific (excluding high income)East Asia & Pacific (IDA & IBRD countries)EcuadorEgypt, Arab Rep.El SalvadorEquatorial GuineaEritreaEstoniaEthiopiaEuro areaEurope & Central AsiaEurope & Central Asia (excluding high income)Europe & Central Asia (IDA & IBRD countries)European UnionFijiFinlandFragile and conflict affected situationsFranceGabonGambia, TheGeorgiaGermanyGhanaGreeceGrenadaGuatemalaGuineaGuinea-BissauGuyanaHaitiHeavily indebted poor countries (HIPC)High incomeHondurasHong Kong SAR, ChinaHungaryIBRD onlyIcelandIDA & IBRD totalIDA blendIDA onlyIDA totalIndiaIndonesiaIran, Islamic Rep.IraqIrelandIsraelItalyJamaicaJapanJordanKazakhstanKenyaKorea, Rep.KosovoKuwaitKyrgyz RepublicLao PDRLate-demographic dividendLatin America & Caribbean Latin America & Caribbean (excluding high income)Latin America & the Caribbean (IDA & IBRD countries)LatviaLeast developed countries: UN classificationLebanonLesothoLiberiaLibyaLithuaniaLow & middle incomeLow incomeLower middle incomeLuxembourgMacao SAR, ChinaMacedonia, FYRMadagascarMalawiMalaysiaMaldivesMaliMaltaMauritaniaMauritiusMexicoMicronesia, Fed. Sts.Middle East & North AfricaMiddle East & North Africa (excluding high income)Middle East & North Africa (IDA & IBRD countries)Middle incomeMoldovaMongoliaMontenegroMoroccoMozambiqueMyanmarNamibiaNepalNetherlandsNew ZealandNicaraguaNigerNigeriaNorth AmericaNorwayOECD membersOmanOther small statesPacific island small statesPakistanPanamaPapua New GuineaParaguayPeruPhilippinesPolandPortugalPost-demographic dividendPre-demographic dividendQatarRomaniaRussian FederationRwandaSamoaSao Tome and PrincipeSaudi ArabiaSenegalSerbiaSeychellesSierra LeoneSingaporeSlovak RepublicSloveniaSmall statesSolomon IslandsSouth AfricaSouth AsiaSouth Asia (IDA & IBRD)South SudanSpainSri LankaSt. Kitts and NevisSt. LuciaSt. Vincent and the GrenadinesSub-Saharan Africa Sub-Saharan Africa (excluding high income)Sub-Saharan Africa (IDA & IBRD countries)SudanSurinameSwazilandSwedenSwitzerlandSyrian Arab RepublicTajikistanTanzaniaThailandTimor-LesteTogoTongaTrinidad and TobagoTunisiaTurkeyUgandaUkraineUnited Arab EmiratesUnited KingdomUnited StatesUpper middle incomeUruguayVanuatuVenezuela, RBVietnamWest Bank and GazaWorldYemen, Rep.ZambiaZimbabwe Timeline:
This timeline shows a graph from 1961 to 2016 of Denmark. No data until 1960. Number of actual observations by date: 56.
Source name:
World Development Indicators
Source organization:
International Monetary Fund, International Financial Statistics and data files, and World Bank and OECD GDP estimates.
Categories, topics:
Financial Sector
Last updated:
apr 23, 2017
Indicators value changes by year
Minimum:
41.884
jan 1, 1979
Maximum:
239.642
jan 1, 2009
At the date of observation
Value
Absolute change
Change from previous value
jan 1, 1961
50.785
+50.785
0.0%
jan 1, 1962
50.744
-0.041
-0.08%
jan 1, 1963
50.423
-0.321
-0.63%
jan 1, 1964
50.656
+0.233
0.46%
jan 1, 1965
47.595
-3.06
-6.04%
jan 1, 1966
46.884
-0.711
-1.49%
jan 1, 1967
48.51
+1.626
3.47%
jan 1, 1968
48.837
+0.327
0.67%
jan 1, 1969
51.193
+2.356
4.83%
jan 1, 1970
50.189
-1.004
-1.96%
jan 1, 1971
46.635
-3.554
-7.08%
jan 1, 1972
45.406
-1.228
-2.63%
jan 1, 1973
45.188
-0.219
-0.48%
jan 1, 1974
43.695
-1.493
-3.3%
jan 1, 1975
43.028
-0.667
-1.53%
jan 1, 1976
48.706
+5.678
13.2%
jan 1, 1977
48.16
-0.546
-1.12%
jan 1, 1978
44.817
-3.343
-6.94%
jan 1, 1979
41.884
-2.933
-6.54%
jan 1, 1980
42.28
+0.397
0.95%
jan 1, 1981
44.357
+2.077
4.91%
jan 1, 1982
46.409
+2.052
4.63%
jan 1, 1983
46.061
-0.348
-0.75%
jan 1, 1984
51.072
+5.011
10.88%
jan 1, 1985
57.698
+6.627
12.97%
jan 1, 1986
60.54
+2.842
4.93%
jan 1, 1987
65.27
+4.73
7.81%
jan 1, 1988
59.4
-5.869
-8.99%
jan 1, 1989
60.55
+1.15
1.94%
jan 1, 1990
63.454
+2.905
4.8%
jan 1, 1991
60.855
-2.6
-4.1%
jan 1, 1992
63.645
+2.79
4.59%
jan 1, 1993
56.772
-6.872
-10.8%
jan 1, 1994
52.045
-4.727
-8.33%
jan 1, 1995
53.185
+1.14
2.19%
jan 1, 1996
52.63
-0.555
-1.04%
jan 1, 1997
54.487
+1.857
3.53%
jan 1, 1998
54.916
+0.429
0.79%
jan 1, 1999
60.252
+5.336
9.72%
jan 1, 2000
56.185
-4.067
-6.75%
jan 1, 2001
141.152
+84.967
151.23%
jan 1, 2002
148.464
+7.311
5.18%
jan 1, 2003
151.394
+2.93
1.97%
jan 1, 2004
166.52
+15.126
9.99%
jan 1, 2005
173.517
+6.997
4.2%
jan 1, 2006
184.854
+11.337
6.53%
jan 1, 2007
194.773
+9.919
5.37%
jan 1, 2008
214.893
+20.119
10.33%
jan 1, 2009
239.642
+24.75
11.52%
jan 1, 2010
238.3
-1.342
-0.56%
jan 1, 2011
235.691
-2.609
-1.09%
jan 1, 2012
239.522
+3.831
1.63%
jan 1, 2013
231.982
-7.54
-3.15%
jan 1, 2014
217.503
-14.479
-6.24%
jan 1, 2015
222.455
+4.952
2.28%
jan 1, 2016
219.091
-3.364
-1.51%
Ranking of countries by current statistics by years


Comments: