29
/
en
AIzaSyAYiBZKx7MnpbEhh9jyipgxe19OcubqV5w
April 1, 2024
215137
Oman
OMN
true
2
1
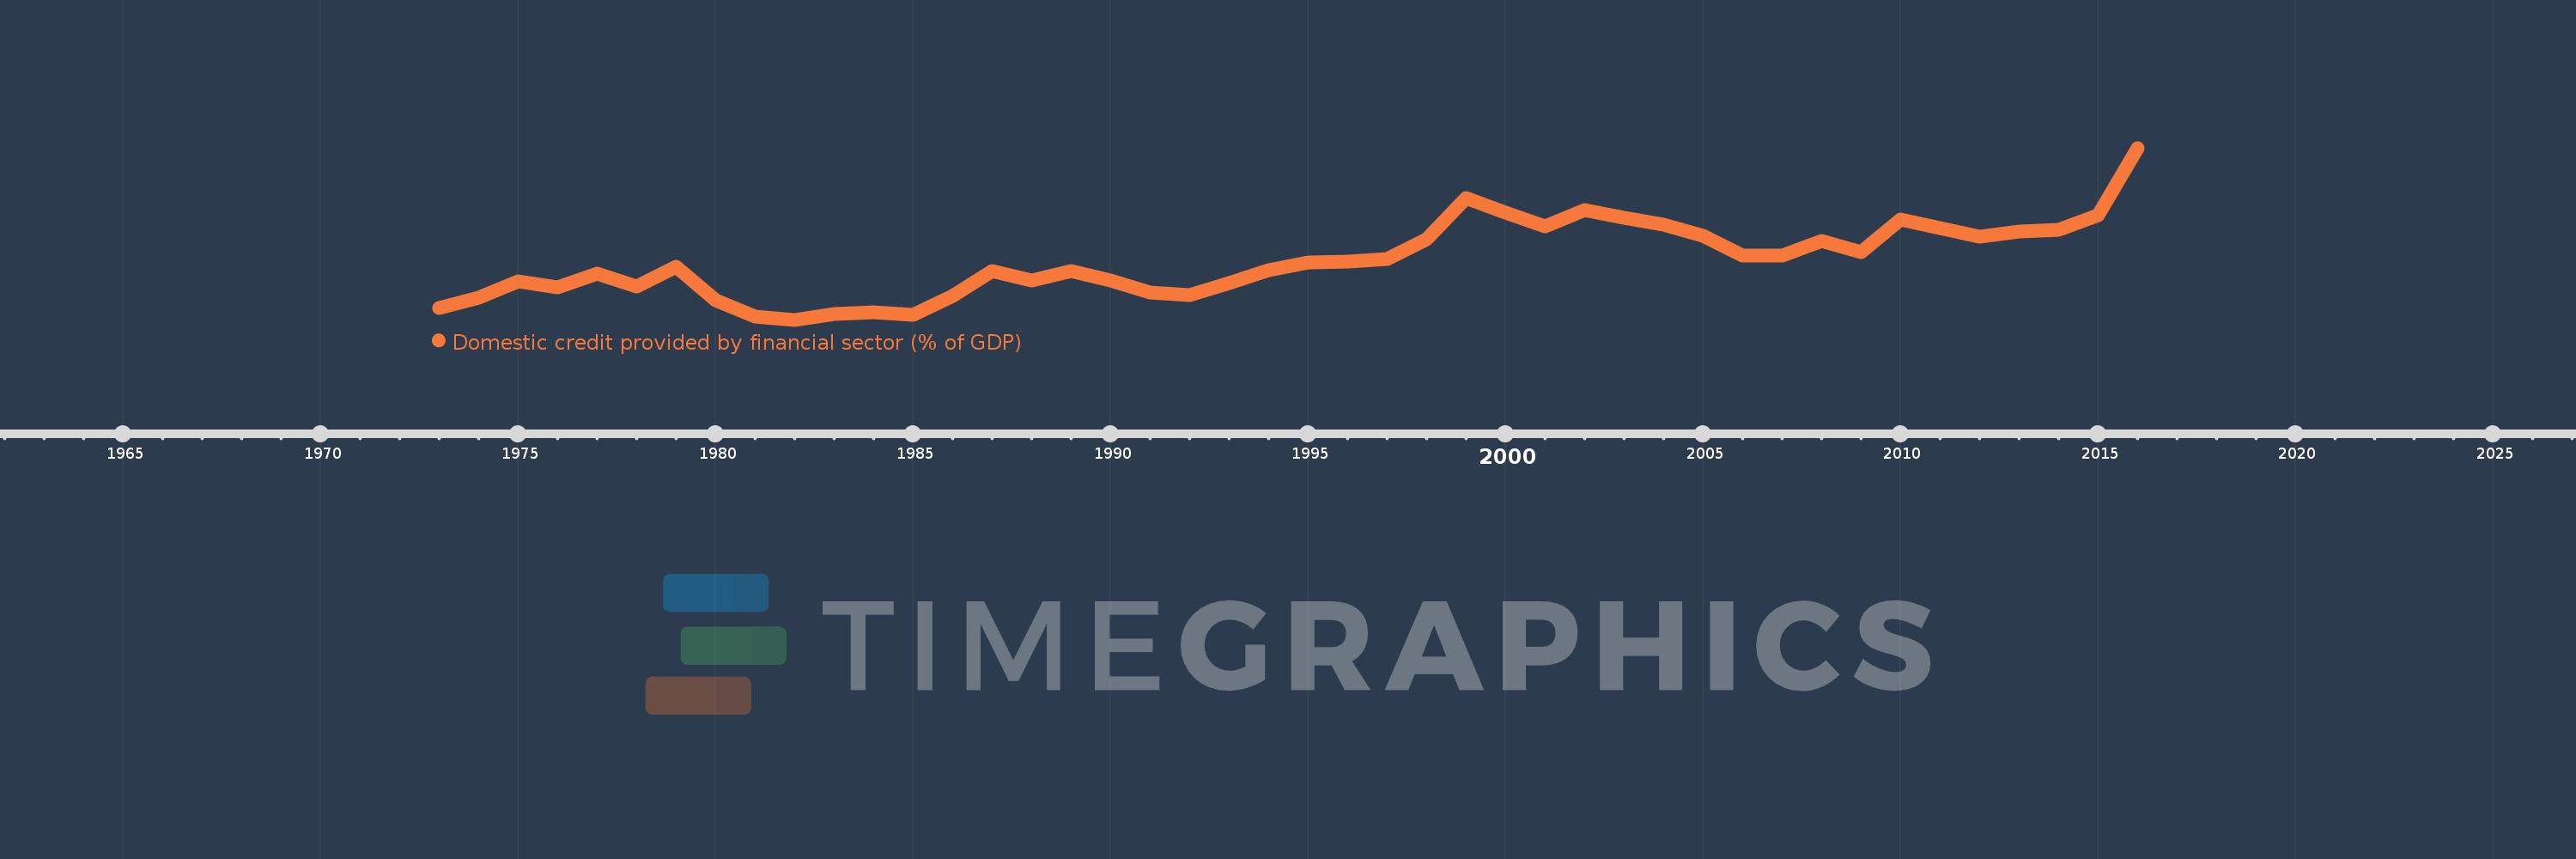
Domestic credit provided by financial sector (% of GDP)
2016,2015,2014,2013,2012,2011,2010,2009,2008,2007,2006,2005,2004,2003,2002,2001,2000,1999,1998,1997,1996,1995,1994,1993,1992,1991,1990,1989,1988,1987,1986,1985,1984,1983,1982,1981,1980,1979,1978,1977,1976,1975,1974,1973
This statistics in other country:
AfghanistanAlbaniaAlgeriaAngolaAntigua and BarbudaArab WorldArgentinaArmeniaArubaAustraliaAustriaAzerbaijanBahamas, TheBahrainBangladeshBarbadosBelarusBelgiumBelizeBeninBhutanBoliviaBosnia and HerzegovinaBotswanaBrazilBrunei DarussalamBulgariaBurkina FasoBurundiCabo VerdeCambodiaCameroonCanadaCaribbean small statesCentral African RepublicCentral Europe and the BalticsChadChileChinaColombiaComorosCongo, Dem. Rep.Congo, Rep.Costa RicaCote d'IvoireCroatiaCyprusCzech RepublicDenmarkDjiboutiDominicaDominican RepublicEarly-demographic dividendEast Asia & PacificEast Asia & Pacific (excluding high income)East Asia & Pacific (IDA & IBRD countries)EcuadorEgypt, Arab Rep.El SalvadorEquatorial GuineaEritreaEstoniaEthiopiaEuro areaEurope & Central AsiaEurope & Central Asia (excluding high income)Europe & Central Asia (IDA & IBRD countries)European UnionFijiFinlandFragile and conflict affected situationsFranceGabonGambia, TheGeorgiaGermanyGhanaGreeceGrenadaGuatemalaGuineaGuinea-BissauGuyanaHaitiHeavily indebted poor countries (HIPC)High incomeHondurasHong Kong SAR, ChinaHungaryIBRD onlyIcelandIDA & IBRD totalIDA blendIDA onlyIDA totalIndiaIndonesiaIran, Islamic Rep.IraqIrelandIsraelItalyJamaicaJapanJordanKazakhstanKenyaKorea, Rep.KosovoKuwaitKyrgyz RepublicLao PDRLate-demographic dividendLatin America & Caribbean Latin America & Caribbean (excluding high income)Latin America & the Caribbean (IDA & IBRD countries)LatviaLeast developed countries: UN classificationLebanonLesothoLiberiaLibyaLithuaniaLow & middle incomeLow incomeLower middle incomeLuxembourgMacao SAR, ChinaMacedonia, FYRMadagascarMalawiMalaysiaMaldivesMaliMaltaMauritaniaMauritiusMexicoMicronesia, Fed. Sts.Middle East & North AfricaMiddle East & North Africa (excluding high income)Middle East & North Africa (IDA & IBRD countries)Middle incomeMoldovaMongoliaMontenegroMoroccoMozambiqueMyanmarNamibiaNepalNetherlandsNew ZealandNicaraguaNigerNigeriaNorth AmericaNorwayOECD membersOmanOther small statesPacific island small statesPakistanPanamaPapua New GuineaParaguayPeruPhilippinesPolandPortugalPost-demographic dividendPre-demographic dividendQatarRomaniaRussian FederationRwandaSamoaSao Tome and PrincipeSaudi ArabiaSenegalSerbiaSeychellesSierra LeoneSingaporeSlovak RepublicSloveniaSmall statesSolomon IslandsSouth AfricaSouth AsiaSouth Asia (IDA & IBRD)South SudanSpainSri LankaSt. Kitts and NevisSt. LuciaSt. Vincent and the GrenadinesSub-Saharan Africa Sub-Saharan Africa (excluding high income)Sub-Saharan Africa (IDA & IBRD countries)SudanSurinameSwazilandSwedenSwitzerlandSyrian Arab RepublicTajikistanTanzaniaThailandTimor-LesteTogoTongaTrinidad and TobagoTunisiaTurkeyUgandaUkraineUnited Arab EmiratesUnited KingdomUnited StatesUpper middle incomeUruguayVanuatuVenezuela, RBVietnamWest Bank and GazaWorldYemen, Rep.ZambiaZimbabwe Timeline:
This timeline shows a graph from 1973 to 2016 of Oman. No data until 1972. Number of actual observations by date: 44.
Source name:
World Development Indicators
Source organization:
International Monetary Fund, International Financial Statistics and data files, and World Bank and OECD GDP estimates.
Categories, topics:
Financial Sector
Last updated:
apr 23, 2017
Indicators value changes by year
Maximum:
64.591
jan 1, 2016
At the date of observation
Value
Absolute change
Change from previous value
jan 1, 1973
9.555
+9.555
0.0%
jan 1, 1974
13.184
+3.628
37.97%
jan 1, 1975
18.767
+5.583
42.35%
jan 1, 1976
16.791
-1.976
-10.53%
jan 1, 1977
21.339
+4.549
27.09%
jan 1, 1978
16.889
-4.451
-20.86%
jan 1, 1979
23.852
+6.963
41.23%
jan 1, 1980
12.306
-11.546
-48.41%
jan 1, 1981
6.589
-5.717
-46.46%
jan 1, 1982
5.577
-1.012
-15.36%
jan 1, 1983
7.506
+1.929
34.59%
jan 1, 1984
8.1
+0.594
7.91%
jan 1, 1985
7.198
-0.902
-11.14%
jan 1, 1986
13.65
+6.452
89.64%
jan 1, 1987
22.406
+8.757
64.15%
jan 1, 1988
19.205
-3.202
-14.29%
jan 1, 1989
22.206
+3.001
15.63%
jan 1, 1990
19.088
-3.118
-14.04%
jan 1, 1991
14.999
-4.089
-21.42%
jan 1, 1992
14.168
-0.831
-5.54%
jan 1, 1993
18.262
+4.093
28.89%
jan 1, 1994
22.74
+4.478
24.52%
jan 1, 1995
25.396
+2.656
11.68%
jan 1, 1996
25.631
+0.236
0.93%
jan 1, 1997
26.389
+0.758
2.96%
jan 1, 1998
33.257
+6.868
26.03%
jan 1, 1999
47.476
+14.219
42.76%
jan 1, 2000
42.514
-4.962
-10.45%
jan 1, 2001
37.623
-4.891
-11.5%
jan 1, 2002
43.2
+5.577
14.82%
jan 1, 2003
40.661
-2.54
-5.88%
jan 1, 2004
38.261
-2.4
-5.9%
jan 1, 2005
34.261
-3.999
-10.45%
jan 1, 2006
27.762
-6.5
-18.97%
jan 1, 2007
27.541
-0.221
-0.79%
jan 1, 2008
32.584
+5.043
18.31%
jan 1, 2009
28.933
-3.652
-11.21%
jan 1, 2010
39.967
+11.034
38.14%
jan 1, 2011
37.171
-2.796
-7.0%
jan 1, 2012
34.125
-3.046
-8.19%
jan 1, 2013
36.017
+1.891
5.54%
jan 1, 2014
36.484
+0.467
1.3%
jan 1, 2015
41.572
+5.088
13.95%
jan 1, 2016
64.591
+23.019
55.37%
Ranking of countries by current statistics by years


Comments: