29
/
en
AIzaSyAYiBZKx7MnpbEhh9jyipgxe19OcubqV5w
April 1, 2024
285755
Zambia
ZMB
true
2
1
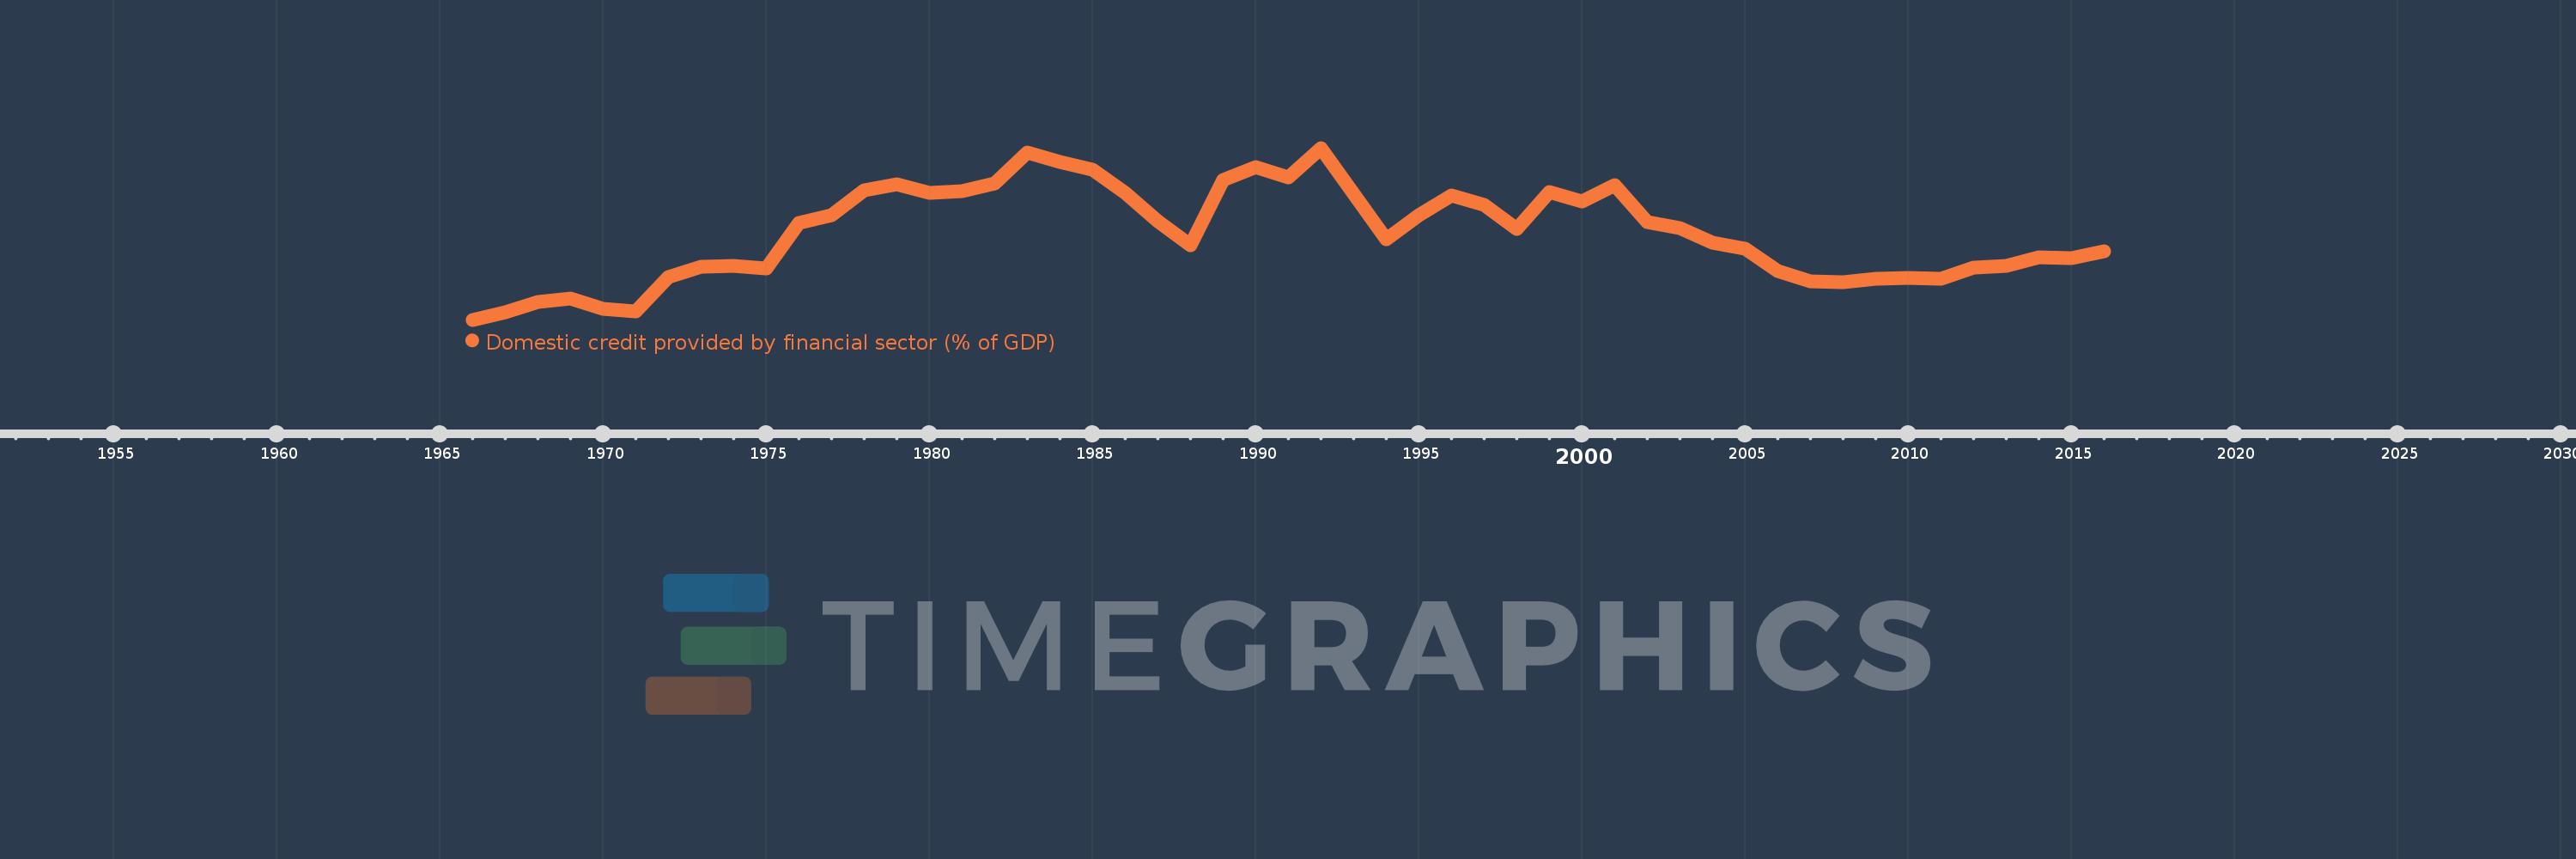
Domestic credit provided by financial sector (% of GDP)
2016,2015,2014,2013,2012,2011,2010,2009,2008,2007,2006,2005,2004,2003,2002,2001,2000,1999,1998,1997,1996,1995,1994,1992,1991,1990,1989,1988,1987,1986,1985,1984,1983,1982,1981,1980,1979,1978,1977,1976,1975,1974,1973,1972,1971,1970,1969,1968,1967,1966
This statistics in other country:
AfghanistanAlbaniaAlgeriaAngolaAntigua and BarbudaArab WorldArgentinaArmeniaArubaAustraliaAustriaAzerbaijanBahamas, TheBahrainBangladeshBarbadosBelarusBelgiumBelizeBeninBhutanBoliviaBosnia and HerzegovinaBotswanaBrazilBrunei DarussalamBulgariaBurkina FasoBurundiCabo VerdeCambodiaCameroonCanadaCaribbean small statesCentral African RepublicCentral Europe and the BalticsChadChileChinaColombiaComorosCongo, Dem. Rep.Congo, Rep.Costa RicaCote d'IvoireCroatiaCyprusCzech RepublicDenmarkDjiboutiDominicaDominican RepublicEarly-demographic dividendEast Asia & PacificEast Asia & Pacific (excluding high income)East Asia & Pacific (IDA & IBRD countries)EcuadorEgypt, Arab Rep.El SalvadorEquatorial GuineaEritreaEstoniaEthiopiaEuro areaEurope & Central AsiaEurope & Central Asia (excluding high income)Europe & Central Asia (IDA & IBRD countries)European UnionFijiFinlandFragile and conflict affected situationsFranceGabonGambia, TheGeorgiaGermanyGhanaGreeceGrenadaGuatemalaGuineaGuinea-BissauGuyanaHaitiHeavily indebted poor countries (HIPC)High incomeHondurasHong Kong SAR, ChinaHungaryIBRD onlyIcelandIDA & IBRD totalIDA blendIDA onlyIDA totalIndiaIndonesiaIran, Islamic Rep.IraqIrelandIsraelItalyJamaicaJapanJordanKazakhstanKenyaKorea, Rep.KosovoKuwaitKyrgyz RepublicLao PDRLate-demographic dividendLatin America & Caribbean Latin America & Caribbean (excluding high income)Latin America & the Caribbean (IDA & IBRD countries)LatviaLeast developed countries: UN classificationLebanonLesothoLiberiaLibyaLithuaniaLow & middle incomeLow incomeLower middle incomeLuxembourgMacao SAR, ChinaMacedonia, FYRMadagascarMalawiMalaysiaMaldivesMaliMaltaMauritaniaMauritiusMexicoMicronesia, Fed. Sts.Middle East & North AfricaMiddle East & North Africa (excluding high income)Middle East & North Africa (IDA & IBRD countries)Middle incomeMoldovaMongoliaMontenegroMoroccoMozambiqueMyanmarNamibiaNepalNetherlandsNew ZealandNicaraguaNigerNigeriaNorth AmericaNorwayOECD membersOmanOther small statesPacific island small statesPakistanPanamaPapua New GuineaParaguayPeruPhilippinesPolandPortugalPost-demographic dividendPre-demographic dividendQatarRomaniaRussian FederationRwandaSamoaSao Tome and PrincipeSaudi ArabiaSenegalSerbiaSeychellesSierra LeoneSingaporeSlovak RepublicSloveniaSmall statesSolomon IslandsSouth AfricaSouth AsiaSouth Asia (IDA & IBRD)South SudanSpainSri LankaSt. Kitts and NevisSt. LuciaSt. Vincent and the GrenadinesSub-Saharan Africa Sub-Saharan Africa (excluding high income)Sub-Saharan Africa (IDA & IBRD countries)SudanSurinameSwazilandSwedenSwitzerlandSyrian Arab RepublicTajikistanTanzaniaThailandTimor-LesteTogoTongaTrinidad and TobagoTunisiaTurkeyUgandaUkraineUnited Arab EmiratesUnited KingdomUnited StatesUpper middle incomeUruguayVanuatuVenezuela, RBVietnamWest Bank and GazaWorldYemen, Rep.ZambiaZimbabwe Timeline:
This timeline shows a graph from 1966 to 2016 of Zambia. No data until 1965. Number of actual observations by date: 50.
Source name:
World Development Indicators
Source organization:
International Monetary Fund, International Financial Statistics and data files, and World Bank and OECD GDP estimates.
Categories, topics:
Financial Sector
Last updated:
apr 23, 2017
Indicators value changes by year
Minimum:
-6.077
jan 1, 1966
Maximum:
83.292
jan 1, 1992
At the date of observation
Value
Absolute change
Change from previous value
jan 1, 1966
-6.077
-6.077
0.0%
jan 1, 1967
-2.034
+4.043
-66.52%
jan 1, 1968
3.048
+5.082
-249.81%
jan 1, 1969
5.01
+1.962
64.39%
jan 1, 1970
-0.318
-5.328
-106.35%
jan 1, 1971
-1.624
-1.306
410.66%
jan 1, 1972
16.307
+17.931
-1.1K%
jan 1, 1973
21.472
+5.165
31.67%
jan 1, 1974
21.907
+0.436
2.03%
jan 1, 1975
20.614
-1.293
-5.9%
jan 1, 1976
44.365
+23.75
115.21%
jan 1, 1977
48.227
+3.862
8.71%
jan 1, 1978
61.314
+13.087
27.14%
jan 1, 1979
64.174
+2.86
4.66%
jan 1, 1980
59.749
-4.425
-6.89%
jan 1, 1981
60.819
+1.07
1.79%
jan 1, 1982
65.032
+4.214
6.93%
jan 1, 1983
80.939
+15.907
24.46%
jan 1, 1984
76.071
-4.869
-6.02%
jan 1, 1985
72.074
-3.997
-5.25%
jan 1, 1986
59.721
-12.352
-17.14%
jan 1, 1987
45.007
-14.714
-24.64%
jan 1, 1988
32.681
-12.326
-27.39%
jan 1, 1989
66.435
+33.754
103.28%
jan 1, 1990
73.182
+6.748
10.16%
jan 1, 1991
67.803
-5.379
-7.35%
jan 1, 1992
83.292
+15.489
22.84%
jan 1, 1994
35.76
-47.533
-57.07%
jan 1, 1995
48.195
+12.435
34.77%
jan 1, 1996
58.399
+10.204
21.17%
jan 1, 1997
53.5
-4.898
-8.39%
jan 1, 1998
40.959
-12.541
-23.44%
jan 1, 1999
60.164
+19.205
46.89%
jan 1, 2000
55.247
-4.917
-8.17%
jan 1, 2001
63.962
+8.715
15.78%
jan 1, 2002
44.84
-19.122
-29.9%
jan 1, 2003
41.398
-3.442
-7.68%
jan 1, 2004
33.89
-7.508
-18.14%
jan 1, 2005
30.675
-3.215
-9.49%
jan 1, 2006
19.435
-11.24
-36.64%
jan 1, 2007
13.974
-5.461
-28.1%
jan 1, 2008
13.458
-0.515
-3.69%
jan 1, 2009
15.409
+1.951
14.5%
jan 1, 2010
15.483
+0.074
0.48%
jan 1, 2011
15.109
-0.374
-2.42%
jan 1, 2012
21.085
+5.975
39.55%
jan 1, 2013
21.933
+0.848
4.02%
jan 1, 2014
26.269
+4.336
19.77%
jan 1, 2015
25.807
-0.462
-1.76%
jan 1, 2016
29.667
+3.861
14.96%
Ranking of countries by current statistics by years


Comments: