29
/
en
AIzaSyAYiBZKx7MnpbEhh9jyipgxe19OcubqV5w
April 1, 2024
204029
Myanmar
MMR
true
2
1
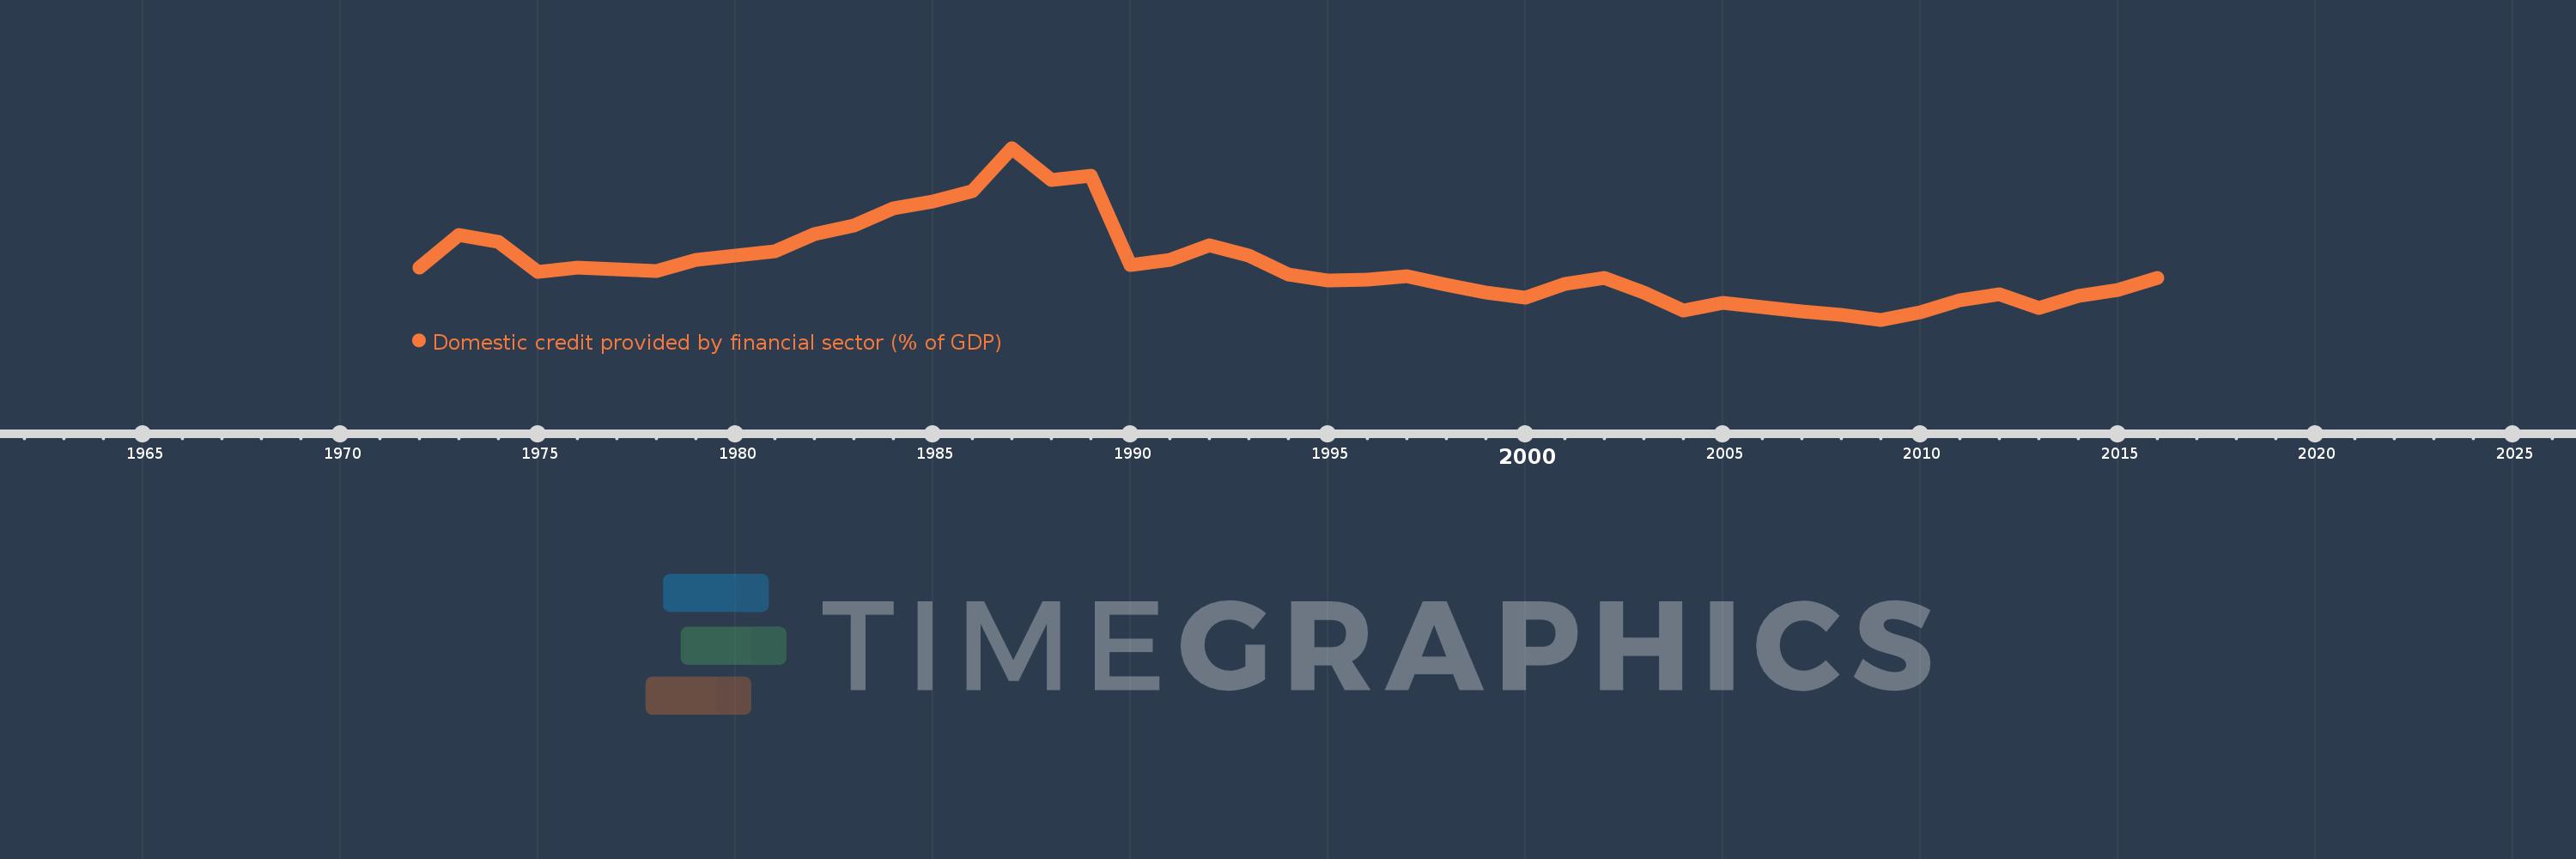
Domestic credit provided by financial sector (% of GDP)
2016,2015,2014,2013,2012,2011,2010,2009,2008,2007,2006,2005,2004,2003,2002,2001,2000,1999,1998,1997,1996,1995,1994,1993,1992,1991,1990,1989,1988,1987,1986,1985,1984,1983,1982,1981,1980,1979,1978,1977,1976,1975,1974,1973,1972
This statistics in other country:
AfghanistanAlbaniaAlgeriaAngolaAntigua and BarbudaArab WorldArgentinaArmeniaArubaAustraliaAustriaAzerbaijanBahamas, TheBahrainBangladeshBarbadosBelarusBelgiumBelizeBeninBhutanBoliviaBosnia and HerzegovinaBotswanaBrazilBrunei DarussalamBulgariaBurkina FasoBurundiCabo VerdeCambodiaCameroonCanadaCaribbean small statesCentral African RepublicCentral Europe and the BalticsChadChileChinaColombiaComorosCongo, Dem. Rep.Congo, Rep.Costa RicaCote d'IvoireCroatiaCyprusCzech RepublicDenmarkDjiboutiDominicaDominican RepublicEarly-demographic dividendEast Asia & PacificEast Asia & Pacific (excluding high income)East Asia & Pacific (IDA & IBRD countries)EcuadorEgypt, Arab Rep.El SalvadorEquatorial GuineaEritreaEstoniaEthiopiaEuro areaEurope & Central AsiaEurope & Central Asia (excluding high income)Europe & Central Asia (IDA & IBRD countries)European UnionFijiFinlandFragile and conflict affected situationsFranceGabonGambia, TheGeorgiaGermanyGhanaGreeceGrenadaGuatemalaGuineaGuinea-BissauGuyanaHaitiHeavily indebted poor countries (HIPC)High incomeHondurasHong Kong SAR, ChinaHungaryIBRD onlyIcelandIDA & IBRD totalIDA blendIDA onlyIDA totalIndiaIndonesiaIran, Islamic Rep.IraqIrelandIsraelItalyJamaicaJapanJordanKazakhstanKenyaKorea, Rep.KosovoKuwaitKyrgyz RepublicLao PDRLate-demographic dividendLatin America & Caribbean Latin America & Caribbean (excluding high income)Latin America & the Caribbean (IDA & IBRD countries)LatviaLeast developed countries: UN classificationLebanonLesothoLiberiaLibyaLithuaniaLow & middle incomeLow incomeLower middle incomeLuxembourgMacao SAR, ChinaMacedonia, FYRMadagascarMalawiMalaysiaMaldivesMaliMaltaMauritaniaMauritiusMexicoMicronesia, Fed. Sts.Middle East & North AfricaMiddle East & North Africa (excluding high income)Middle East & North Africa (IDA & IBRD countries)Middle incomeMoldovaMongoliaMontenegroMoroccoMozambiqueMyanmarNamibiaNepalNetherlandsNew ZealandNicaraguaNigerNigeriaNorth AmericaNorwayOECD membersOmanOther small statesPacific island small statesPakistanPanamaPapua New GuineaParaguayPeruPhilippinesPolandPortugalPost-demographic dividendPre-demographic dividendQatarRomaniaRussian FederationRwandaSamoaSao Tome and PrincipeSaudi ArabiaSenegalSerbiaSeychellesSierra LeoneSingaporeSlovak RepublicSloveniaSmall statesSolomon IslandsSouth AfricaSouth AsiaSouth Asia (IDA & IBRD)South SudanSpainSri LankaSt. Kitts and NevisSt. LuciaSt. Vincent and the GrenadinesSub-Saharan Africa Sub-Saharan Africa (excluding high income)Sub-Saharan Africa (IDA & IBRD countries)SudanSurinameSwazilandSwedenSwitzerlandSyrian Arab RepublicTajikistanTanzaniaThailandTimor-LesteTogoTongaTrinidad and TobagoTunisiaTurkeyUgandaUkraineUnited Arab EmiratesUnited KingdomUnited StatesUpper middle incomeUruguayVanuatuVenezuela, RBVietnamWest Bank and GazaWorldYemen, Rep.ZambiaZimbabwe Timeline:
This timeline shows a graph from 1972 to 2016 of Myanmar. No data until 1971. Number of actual observations by date: 45.
Source name:
World Development Indicators
Source organization:
International Monetary Fund, International Financial Statistics and data files, and World Bank and OECD GDP estimates.
Categories, topics:
Financial Sector
Last updated:
apr 23, 2017
Indicators value changes by year
Minimum:
18.499
jan 1, 2009
Maximum:
78.864
jan 1, 1987
At the date of observation
Value
Absolute change
Change from previous value
jan 1, 1972
36.869
+36.869
0.0%
jan 1, 1973
48.301
+11.432
31.01%
jan 1, 1974
45.914
-2.387
-4.94%
jan 1, 1975
35.273
-10.641
-23.18%
jan 1, 1976
36.951
+1.678
4.76%
jan 1, 1977
36.36
-0.591
-1.6%
jan 1, 1978
35.533
-0.827
-2.28%
jan 1, 1979
39.619
+4.086
11.5%
jan 1, 1980
41.054
+1.435
3.62%
jan 1, 1981
42.601
+1.547
3.77%
jan 1, 1982
48.569
+5.969
14.01%
jan 1, 1983
51.652
+3.082
6.35%
jan 1, 1984
57.726
+6.074
11.76%
jan 1, 1985
59.911
+2.185
3.79%
jan 1, 1986
63.692
+3.781
6.31%
jan 1, 1987
78.864
+15.172
23.82%
jan 1, 1988
67.66
-11.204
-14.21%
jan 1, 1989
68.997
+1.337
1.98%
jan 1, 1990
37.637
-31.36
-45.45%
jan 1, 1991
39.56
+1.923
5.11%
jan 1, 1992
44.583
+5.023
12.7%
jan 1, 1993
40.996
-3.588
-8.05%
jan 1, 1994
34.433
-6.562
-16.01%
jan 1, 1995
32.411
-2.022
-5.87%
jan 1, 1996
32.454
+0.043
0.13%
jan 1, 1997
33.697
+1.244
3.83%
jan 1, 1998
30.659
-3.038
-9.02%
jan 1, 1999
28.149
-2.51
-8.19%
jan 1, 2000
26.235
-1.914
-6.8%
jan 1, 2001
31.173
+4.938
18.82%
jan 1, 2002
33.171
+1.998
6.41%
jan 1, 2003
28.171
-5.0
-15.07%
jan 1, 2004
21.61
-6.561
-23.29%
jan 1, 2005
24.552
+2.941
13.61%
jan 1, 2006
23.063
-1.489
-6.06%
jan 1, 2007
21.353
-1.71
-7.42%
jan 1, 2008
20.198
-1.154
-5.41%
jan 1, 2009
18.499
-1.7
-8.42%
jan 1, 2010
21.161
+2.663
14.39%
jan 1, 2011
25.216
+4.055
19.16%
jan 1, 2012
27.611
+2.395
9.5%
jan 1, 2013
22.719
-4.892
-17.72%
jan 1, 2014
26.752
+4.033
17.75%
jan 1, 2015
28.938
+2.186
8.17%
jan 1, 2016
33.237
+4.299
14.86%
Ranking of countries by current statistics by years


Comments: