29
/
en
AIzaSyAYiBZKx7MnpbEhh9jyipgxe19OcubqV5w
April 1, 2024
206621
Nepal
NPL
true
2
1
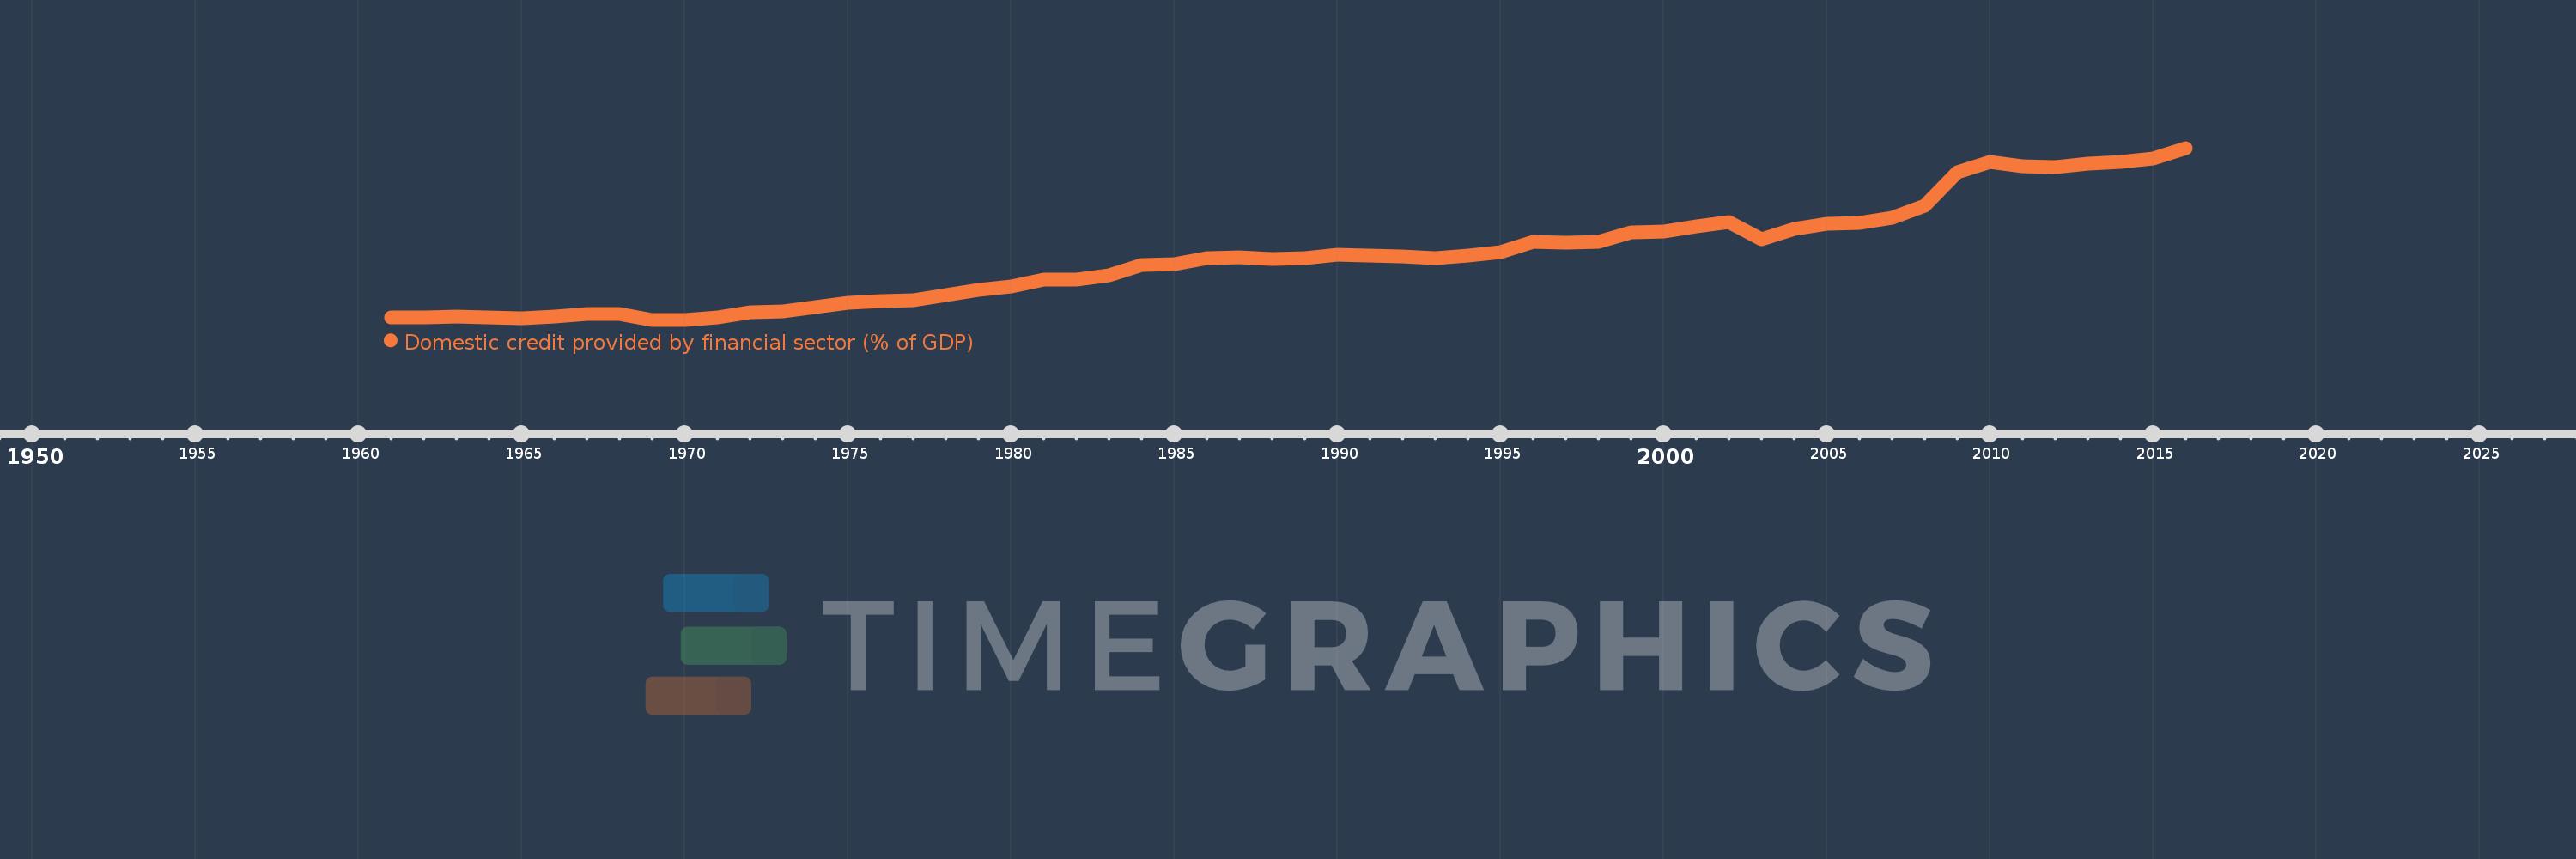
Domestic credit provided by financial sector (% of GDP)
2016,2015,2014,2013,2012,2011,2010,2009,2008,2007,2006,2005,2004,2003,2002,2001,2000,1999,1998,1997,1996,1995,1994,1993,1992,1991,1990,1989,1988,1987,1986,1985,1984,1983,1982,1981,1980,1979,1978,1977,1976,1975,1974,1973,1972,1971,1970,1969,1968,1967,1966,1965,1964,1963,1962,1961
This statistics in other country:
AfghanistanAlbaniaAlgeriaAngolaAntigua and BarbudaArab WorldArgentinaArmeniaArubaAustraliaAustriaAzerbaijanBahamas, TheBahrainBangladeshBarbadosBelarusBelgiumBelizeBeninBhutanBoliviaBosnia and HerzegovinaBotswanaBrazilBrunei DarussalamBulgariaBurkina FasoBurundiCabo VerdeCambodiaCameroonCanadaCaribbean small statesCentral African RepublicCentral Europe and the BalticsChadChileChinaColombiaComorosCongo, Dem. Rep.Congo, Rep.Costa RicaCote d'IvoireCroatiaCyprusCzech RepublicDenmarkDjiboutiDominicaDominican RepublicEarly-demographic dividendEast Asia & PacificEast Asia & Pacific (excluding high income)East Asia & Pacific (IDA & IBRD countries)EcuadorEgypt, Arab Rep.El SalvadorEquatorial GuineaEritreaEstoniaEthiopiaEuro areaEurope & Central AsiaEurope & Central Asia (excluding high income)Europe & Central Asia (IDA & IBRD countries)European UnionFijiFinlandFragile and conflict affected situationsFranceGabonGambia, TheGeorgiaGermanyGhanaGreeceGrenadaGuatemalaGuineaGuinea-BissauGuyanaHaitiHeavily indebted poor countries (HIPC)High incomeHondurasHong Kong SAR, ChinaHungaryIBRD onlyIcelandIDA & IBRD totalIDA blendIDA onlyIDA totalIndiaIndonesiaIran, Islamic Rep.IraqIrelandIsraelItalyJamaicaJapanJordanKazakhstanKenyaKorea, Rep.KosovoKuwaitKyrgyz RepublicLao PDRLate-demographic dividendLatin America & Caribbean Latin America & Caribbean (excluding high income)Latin America & the Caribbean (IDA & IBRD countries)LatviaLeast developed countries: UN classificationLebanonLesothoLiberiaLibyaLithuaniaLow & middle incomeLow incomeLower middle incomeLuxembourgMacao SAR, ChinaMacedonia, FYRMadagascarMalawiMalaysiaMaldivesMaliMaltaMauritaniaMauritiusMexicoMicronesia, Fed. Sts.Middle East & North AfricaMiddle East & North Africa (excluding high income)Middle East & North Africa (IDA & IBRD countries)Middle incomeMoldovaMongoliaMontenegroMoroccoMozambiqueMyanmarNamibiaNepalNetherlandsNew ZealandNicaraguaNigerNigeriaNorth AmericaNorwayOECD membersOmanOther small statesPacific island small statesPakistanPanamaPapua New GuineaParaguayPeruPhilippinesPolandPortugalPost-demographic dividendPre-demographic dividendQatarRomaniaRussian FederationRwandaSamoaSao Tome and PrincipeSaudi ArabiaSenegalSerbiaSeychellesSierra LeoneSingaporeSlovak RepublicSloveniaSmall statesSolomon IslandsSouth AfricaSouth AsiaSouth Asia (IDA & IBRD)South SudanSpainSri LankaSt. Kitts and NevisSt. LuciaSt. Vincent and the GrenadinesSub-Saharan Africa Sub-Saharan Africa (excluding high income)Sub-Saharan Africa (IDA & IBRD countries)SudanSurinameSwazilandSwedenSwitzerlandSyrian Arab RepublicTajikistanTanzaniaThailandTimor-LesteTogoTongaTrinidad and TobagoTunisiaTurkeyUgandaUkraineUnited Arab EmiratesUnited KingdomUnited StatesUpper middle incomeUruguayVanuatuVenezuela, RBVietnamWest Bank and GazaWorldYemen, Rep.ZambiaZimbabwe Timeline:
This timeline shows a graph from 1961 to 2016 of Nepal. No data until 1960. Number of actual observations by date: 56.
Source name:
World Development Indicators
Source organization:
International Monetary Fund, International Financial Statistics and data files, and World Bank and OECD GDP estimates.
Categories, topics:
Financial Sector
Last updated:
apr 23, 2017
Indicators value changes by year
Minimum:
-0.074
jan 1, 1970
Maximum:
75.298
jan 1, 2016
At the date of observation
Value
Absolute change
Change from previous value
jan 1, 1961
1.048
+1.048
0.0%
jan 1, 1962
1.098
+0.05
4.74%
jan 1, 1963
1.235
+0.137
12.44%
jan 1, 1964
0.882
-0.353
-28.58%
jan 1, 1965
0.695
-0.187
-21.2%
jan 1, 1966
1.491
+0.796
114.53%
jan 1, 1967
2.326
+0.835
56.05%
jan 1, 1968
2.639
+0.313
13.46%
jan 1, 1969
-0.056
-2.695
-102.11%
jan 1, 1970
-0.074
-0.018
32.5%
jan 1, 1971
0.83
+0.904
-1.22K%
jan 1, 1972
3.22
+2.389
287.76%
jan 1, 1973
3.746
+0.526
16.34%
jan 1, 1974
5.42
+1.675
44.71%
jan 1, 1975
7.328
+1.908
35.2%
jan 1, 1976
8.052
+0.724
9.88%
jan 1, 1977
8.406
+0.354
4.39%
jan 1, 1978
10.834
+2.429
28.89%
jan 1, 1979
13.096
+2.261
20.87%
jan 1, 1980
14.402
+1.306
9.98%
jan 1, 1981
17.342
+2.939
20.41%
jan 1, 1982
17.588
+0.246
1.42%
jan 1, 1983
19.404
+1.817
10.33%
jan 1, 1984
23.766
+4.362
22.48%
jan 1, 1985
24.287
+0.521
2.19%
jan 1, 1986
27.086
+2.799
11.53%
jan 1, 1987
27.262
+0.176
0.65%
jan 1, 1988
26.501
-0.761
-2.79%
jan 1, 1989
26.93
+0.429
1.62%
jan 1, 1990
28.274
+1.344
4.99%
jan 1, 1991
27.961
-0.313
-1.11%
jan 1, 1992
27.632
-0.329
-1.18%
jan 1, 1993
26.981
-0.651
-2.35%
jan 1, 1994
28.105
+1.123
4.16%
jan 1, 1995
29.541
+1.437
5.11%
jan 1, 1996
33.963
+4.421
14.97%
jan 1, 1997
33.69
-0.273
-0.8%
jan 1, 1998
34.162
+0.471
1.4%
jan 1, 1999
38.321
+4.159
12.18%
jan 1, 2000
38.681
+0.36
0.94%
jan 1, 2001
40.77
+2.089
5.4%
jan 1, 2002
42.683
+1.913
4.69%
jan 1, 2003
35.423
-7.259
-17.01%
jan 1, 2004
39.596
+4.173
11.78%
jan 1, 2005
41.909
+2.313
5.84%
jan 1, 2006
42.225
+0.316
0.75%
jan 1, 2007
44.584
+2.359
5.59%
jan 1, 2008
50.02
+5.437
12.19%
jan 1, 2009
64.613
+14.592
29.17%
jan 1, 2010
69.068
+4.455
6.89%
jan 1, 2011
67.355
-1.713
-2.48%
jan 1, 2012
66.731
-0.624
-0.93%
jan 1, 2013
68.269
+1.537
2.3%
jan 1, 2014
69.008
+0.739
1.08%
jan 1, 2015
70.651
+1.644
2.38%
jan 1, 2016
75.298
+4.647
6.58%
Ranking of countries by current statistics by years


Comments: