29
/
en
AIzaSyAYiBZKx7MnpbEhh9jyipgxe19OcubqV5w
April 1, 2024
234507
Saudi Arabia
SAU
true
2
1
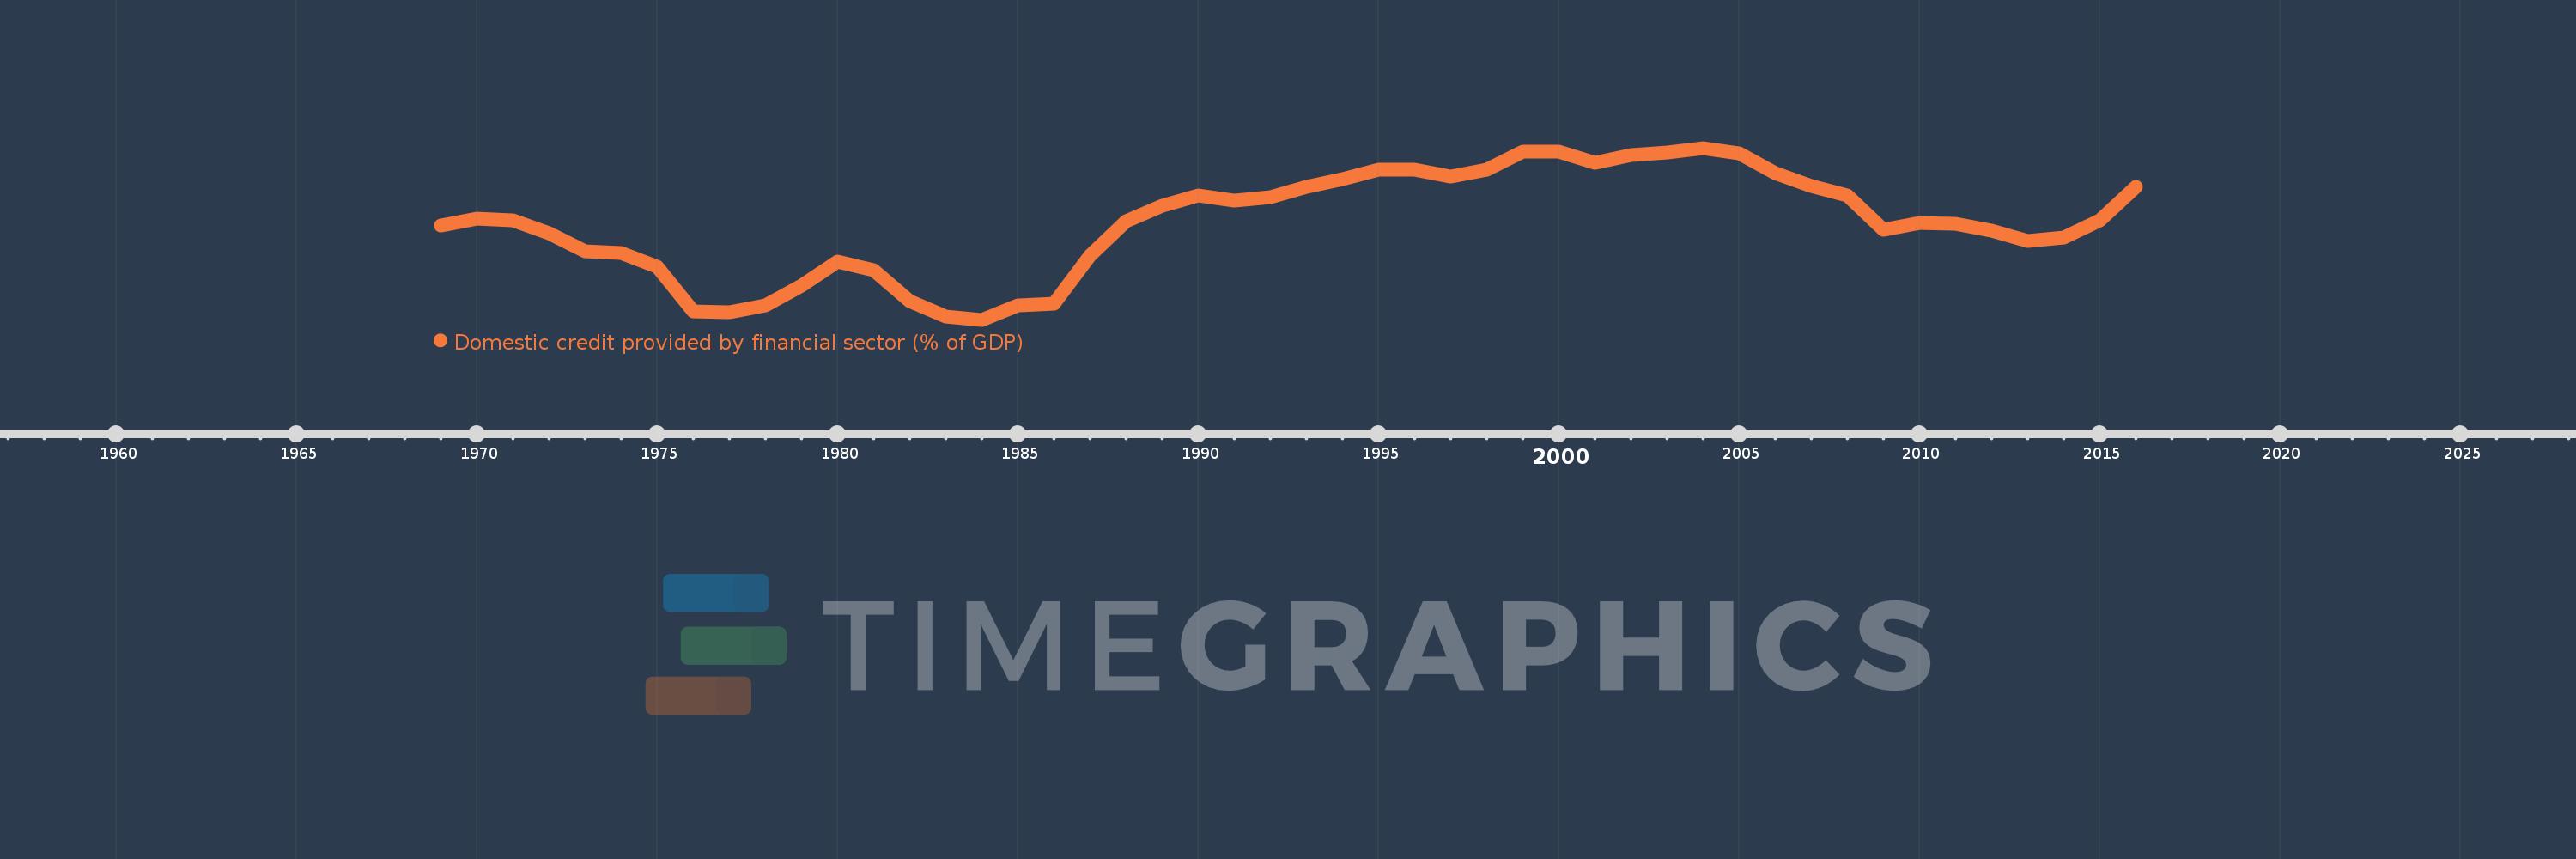
Domestic credit provided by financial sector (% of GDP)
2016,2015,2014,2013,2012,2011,2010,2009,2008,2007,2006,2005,2004,2003,2002,2001,2000,1999,1998,1997,1996,1995,1994,1993,1992,1991,1990,1989,1988,1987,1986,1985,1984,1983,1982,1981,1980,1979,1978,1977,1976,1975,1974,1973,1972,1971,1970,1969
This statistics in other country:
AfghanistanAlbaniaAlgeriaAngolaAntigua and BarbudaArab WorldArgentinaArmeniaArubaAustraliaAustriaAzerbaijanBahamas, TheBahrainBangladeshBarbadosBelarusBelgiumBelizeBeninBhutanBoliviaBosnia and HerzegovinaBotswanaBrazilBrunei DarussalamBulgariaBurkina FasoBurundiCabo VerdeCambodiaCameroonCanadaCaribbean small statesCentral African RepublicCentral Europe and the BalticsChadChileChinaColombiaComorosCongo, Dem. Rep.Congo, Rep.Costa RicaCote d'IvoireCroatiaCyprusCzech RepublicDenmarkDjiboutiDominicaDominican RepublicEarly-demographic dividendEast Asia & PacificEast Asia & Pacific (excluding high income)East Asia & Pacific (IDA & IBRD countries)EcuadorEgypt, Arab Rep.El SalvadorEquatorial GuineaEritreaEstoniaEthiopiaEuro areaEurope & Central AsiaEurope & Central Asia (excluding high income)Europe & Central Asia (IDA & IBRD countries)European UnionFijiFinlandFragile and conflict affected situationsFranceGabonGambia, TheGeorgiaGermanyGhanaGreeceGrenadaGuatemalaGuineaGuinea-BissauGuyanaHaitiHeavily indebted poor countries (HIPC)High incomeHondurasHong Kong SAR, ChinaHungaryIBRD onlyIcelandIDA & IBRD totalIDA blendIDA onlyIDA totalIndiaIndonesiaIran, Islamic Rep.IraqIrelandIsraelItalyJamaicaJapanJordanKazakhstanKenyaKorea, Rep.KosovoKuwaitKyrgyz RepublicLao PDRLate-demographic dividendLatin America & Caribbean Latin America & Caribbean (excluding high income)Latin America & the Caribbean (IDA & IBRD countries)LatviaLeast developed countries: UN classificationLebanonLesothoLiberiaLibyaLithuaniaLow & middle incomeLow incomeLower middle incomeLuxembourgMacao SAR, ChinaMacedonia, FYRMadagascarMalawiMalaysiaMaldivesMaliMaltaMauritaniaMauritiusMexicoMicronesia, Fed. Sts.Middle East & North AfricaMiddle East & North Africa (excluding high income)Middle East & North Africa (IDA & IBRD countries)Middle incomeMoldovaMongoliaMontenegroMoroccoMozambiqueMyanmarNamibiaNepalNetherlandsNew ZealandNicaraguaNigerNigeriaNorth AmericaNorwayOECD membersOmanOther small statesPacific island small statesPakistanPanamaPapua New GuineaParaguayPeruPhilippinesPolandPortugalPost-demographic dividendPre-demographic dividendQatarRomaniaRussian FederationRwandaSamoaSao Tome and PrincipeSaudi ArabiaSenegalSerbiaSeychellesSierra LeoneSingaporeSlovak RepublicSloveniaSmall statesSolomon IslandsSouth AfricaSouth AsiaSouth Asia (IDA & IBRD)South SudanSpainSri LankaSt. Kitts and NevisSt. LuciaSt. Vincent and the GrenadinesSub-Saharan Africa Sub-Saharan Africa (excluding high income)Sub-Saharan Africa (IDA & IBRD countries)SudanSurinameSwazilandSwedenSwitzerlandSyrian Arab RepublicTajikistanTanzaniaThailandTimor-LesteTogoTongaTrinidad and TobagoTunisiaTurkeyUgandaUkraineUnited Arab EmiratesUnited KingdomUnited StatesUpper middle incomeUruguayVanuatuVenezuela, RBVietnamWest Bank and GazaWorldYemen, Rep.ZambiaZimbabwe Timeline:
This timeline shows a graph from 1969 to 2016 of Saudi Arabia. No data until 1968. Number of actual observations by date: 48.
Source name:
World Development Indicators
Source organization:
International Monetary Fund, International Financial Statistics and data files, and World Bank and OECD GDP estimates.
Categories, topics:
Financial Sector
Last updated:
apr 23, 2017
Indicators value changes by year
Minimum:
-55.235
jan 1, 1984
Maximum:
43.311
jan 1, 2004
At the date of observation
Value
Absolute change
Change from previous value
jan 1, 1969
-1.166
-1.166
0.0%
jan 1, 1970
2.944
+4.11
-352.53%
jan 1, 1971
1.626
-1.318
-44.78%
jan 1, 1972
-5.462
-7.088
-435.99%
jan 1, 1973
-15.91
-10.448
191.27%
jan 1, 1974
-17.077
-1.166
7.33%
jan 1, 1975
-25.075
-7.998
46.83%
jan 1, 1976
-50.246
-25.172
100.39%
jan 1, 1977
-50.941
-0.695
1.38%
jan 1, 1978
-46.898
+4.043
-7.94%
jan 1, 1979
-35.744
+11.154
-23.78%
jan 1, 1980
-21.825
+13.919
-38.94%
jan 1, 1981
-26.563
-4.738
21.71%
jan 1, 1982
-44.519
-17.956
67.6%
jan 1, 1983
-53.413
-8.894
19.98%
jan 1, 1984
-55.235
-1.822
3.41%
jan 1, 1985
-47.248
+7.987
-14.46%
jan 1, 1986
-45.847
+1.401
-2.97%
jan 1, 1987
-18.372
+27.475
-59.93%
jan 1, 1988
1.219
+19.591
-106.64%
jan 1, 1989
10.18
+8.961
735.02%
jan 1, 1990
15.892
+5.712
56.11%
jan 1, 1991
12.874
-3.018
-18.99%
jan 1, 1992
15.228
+2.354
18.28%
jan 1, 1993
20.895
+5.667
37.22%
jan 1, 1994
25.362
+4.467
21.38%
jan 1, 1995
30.736
+5.375
21.19%
jan 1, 1996
30.602
-0.135
-0.44%
jan 1, 1997
27.084
-3.518
-11.5%
jan 1, 1998
30.626
+3.542
13.08%
jan 1, 1999
41.138
+10.512
34.32%
jan 1, 2000
41.056
-0.083
-0.2%
jan 1, 2001
34.738
-6.318
-15.39%
jan 1, 2002
39.359
+4.621
13.3%
jan 1, 2003
40.943
+1.585
4.03%
jan 1, 2004
43.311
+2.368
5.78%
jan 1, 2005
40.351
-2.96
-6.83%
jan 1, 2006
28.824
-11.527
-28.57%
jan 1, 2007
21.304
-7.52
-26.09%
jan 1, 2008
16.103
-5.201
-24.41%
jan 1, 2009
-3.653
-19.756
-122.68%
jan 1, 2010
0.524
+4.177
-114.34%
jan 1, 2011
-0.125
-0.649
-123.88%
jan 1, 2012
-4.113
-3.988
3.19K%
jan 1, 2013
-10.18
-6.067
147.52%
jan 1, 2014
-7.886
+2.294
-22.53%
jan 1, 2015
1.771
+9.657
-122.46%
jan 1, 2016
20.763
+18.992
1.07K%
Ranking of countries by current statistics by years


Comments: