29
/
en
AIzaSyAYiBZKx7MnpbEhh9jyipgxe19OcubqV5w
April 1, 2024
162412
Jamaica
JAM
true
2
1
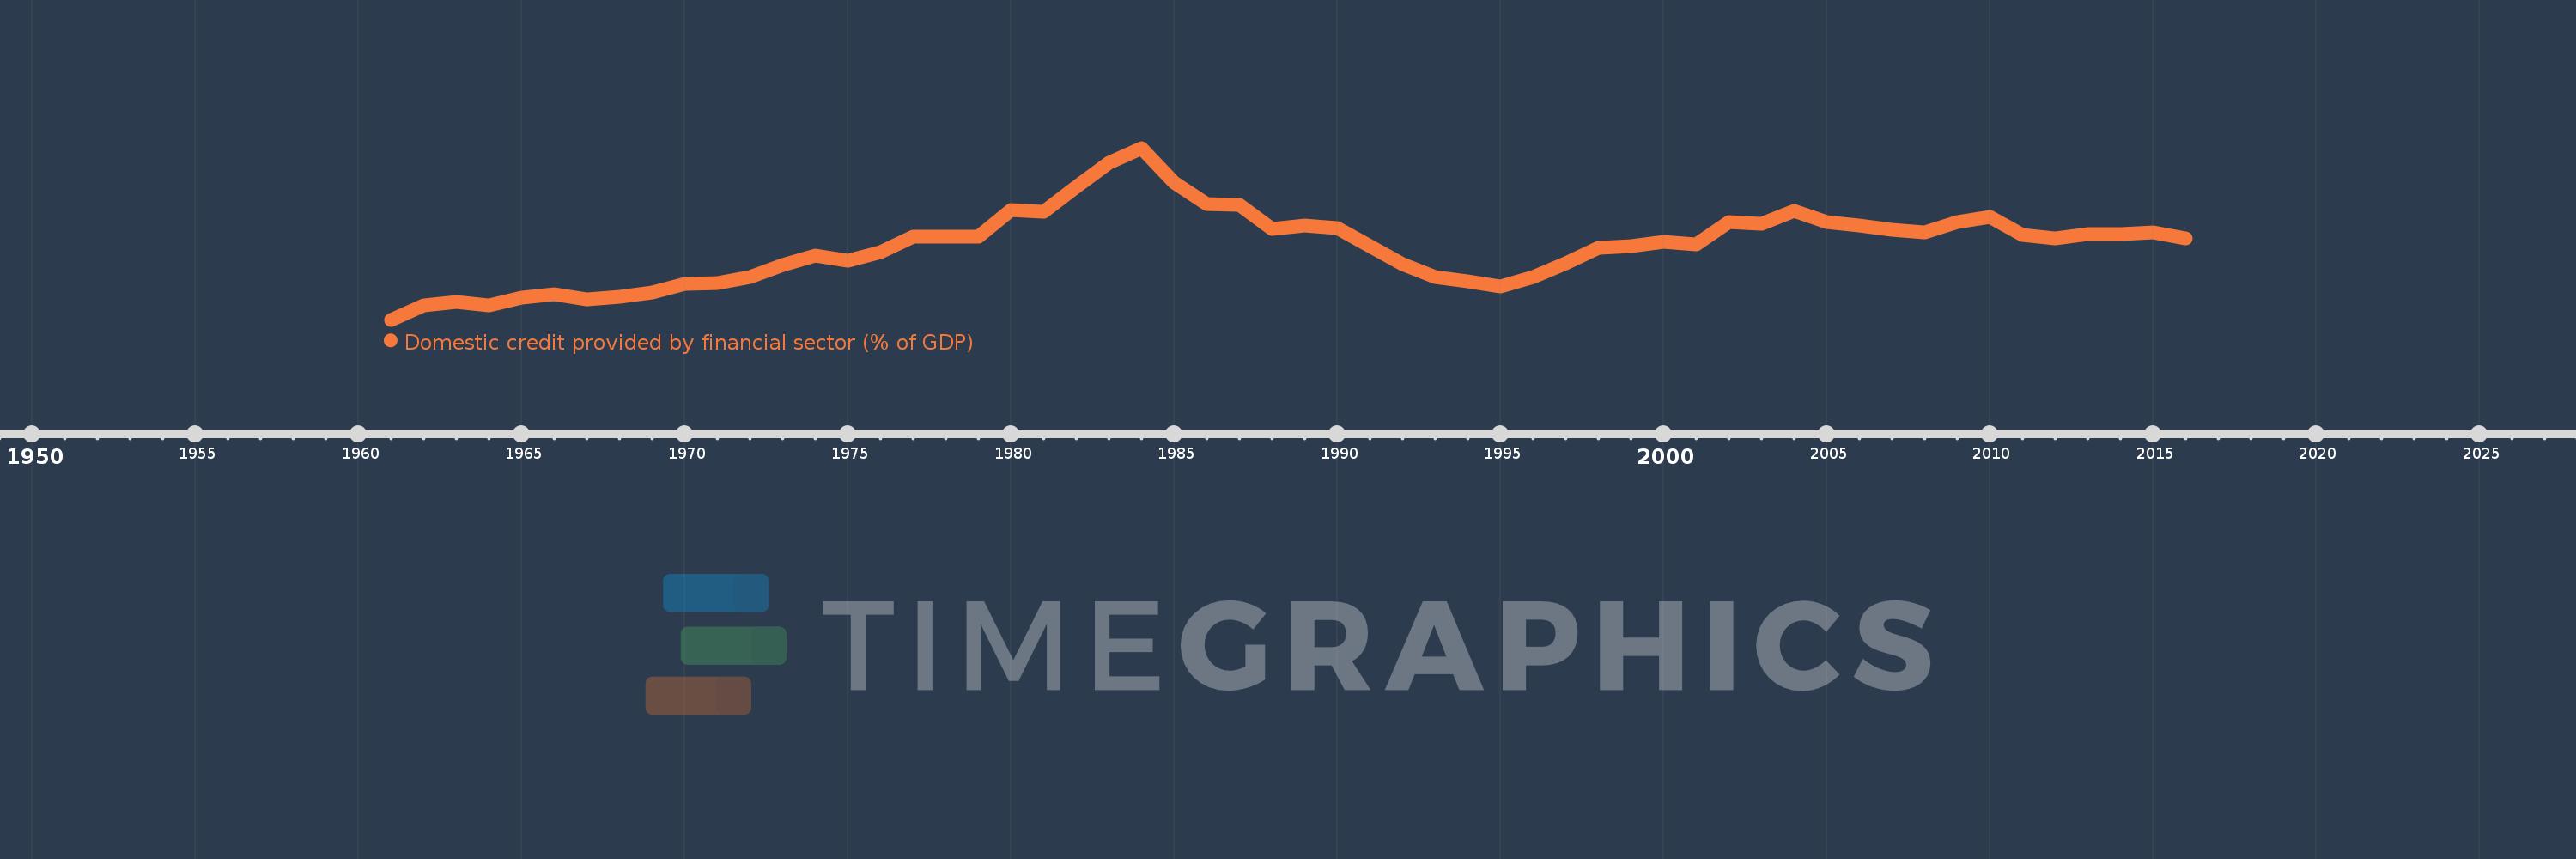
Domestic credit provided by financial sector (% of GDP)
2016,2015,2014,2013,2012,2011,2010,2009,2008,2007,2006,2005,2004,2003,2002,2001,2000,1999,1998,1997,1996,1995,1994,1993,1992,1991,1990,1989,1988,1987,1986,1985,1984,1983,1982,1981,1980,1979,1978,1977,1976,1975,1974,1973,1972,1971,1970,1969,1968,1967,1966,1965,1964,1963,1962,1961
This statistics in other country:
AfghanistanAlbaniaAlgeriaAngolaAntigua and BarbudaArab WorldArgentinaArmeniaArubaAustraliaAustriaAzerbaijanBahamas, TheBahrainBangladeshBarbadosBelarusBelgiumBelizeBeninBhutanBoliviaBosnia and HerzegovinaBotswanaBrazilBrunei DarussalamBulgariaBurkina FasoBurundiCabo VerdeCambodiaCameroonCanadaCaribbean small statesCentral African RepublicCentral Europe and the BalticsChadChileChinaColombiaComorosCongo, Dem. Rep.Congo, Rep.Costa RicaCote d'IvoireCroatiaCyprusCzech RepublicDenmarkDjiboutiDominicaDominican RepublicEarly-demographic dividendEast Asia & PacificEast Asia & Pacific (excluding high income)East Asia & Pacific (IDA & IBRD countries)EcuadorEgypt, Arab Rep.El SalvadorEquatorial GuineaEritreaEstoniaEthiopiaEuro areaEurope & Central AsiaEurope & Central Asia (excluding high income)Europe & Central Asia (IDA & IBRD countries)European UnionFijiFinlandFragile and conflict affected situationsFranceGabonGambia, TheGeorgiaGermanyGhanaGreeceGrenadaGuatemalaGuineaGuinea-BissauGuyanaHaitiHeavily indebted poor countries (HIPC)High incomeHondurasHong Kong SAR, ChinaHungaryIBRD onlyIcelandIDA & IBRD totalIDA blendIDA onlyIDA totalIndiaIndonesiaIran, Islamic Rep.IraqIrelandIsraelItalyJamaicaJapanJordanKazakhstanKenyaKorea, Rep.KosovoKuwaitKyrgyz RepublicLao PDRLate-demographic dividendLatin America & Caribbean Latin America & Caribbean (excluding high income)Latin America & the Caribbean (IDA & IBRD countries)LatviaLeast developed countries: UN classificationLebanonLesothoLiberiaLibyaLithuaniaLow & middle incomeLow incomeLower middle incomeLuxembourgMacao SAR, ChinaMacedonia, FYRMadagascarMalawiMalaysiaMaldivesMaliMaltaMauritaniaMauritiusMexicoMicronesia, Fed. Sts.Middle East & North AfricaMiddle East & North Africa (excluding high income)Middle East & North Africa (IDA & IBRD countries)Middle incomeMoldovaMongoliaMontenegroMoroccoMozambiqueMyanmarNamibiaNepalNetherlandsNew ZealandNicaraguaNigerNigeriaNorth AmericaNorwayOECD membersOmanOther small statesPacific island small statesPakistanPanamaPapua New GuineaParaguayPeruPhilippinesPolandPortugalPost-demographic dividendPre-demographic dividendQatarRomaniaRussian FederationRwandaSamoaSao Tome and PrincipeSaudi ArabiaSenegalSerbiaSeychellesSierra LeoneSingaporeSlovak RepublicSloveniaSmall statesSolomon IslandsSouth AfricaSouth AsiaSouth Asia (IDA & IBRD)South SudanSpainSri LankaSt. Kitts and NevisSt. LuciaSt. Vincent and the GrenadinesSub-Saharan Africa Sub-Saharan Africa (excluding high income)Sub-Saharan Africa (IDA & IBRD countries)SudanSurinameSwazilandSwedenSwitzerlandSyrian Arab RepublicTajikistanTanzaniaThailandTimor-LesteTogoTongaTrinidad and TobagoTunisiaTurkeyUgandaUkraineUnited Arab EmiratesUnited KingdomUnited StatesUpper middle incomeUruguayVanuatuVenezuela, RBVietnamWest Bank and GazaWorldYemen, Rep.ZambiaZimbabwe Timeline:
This timeline shows a graph from 1961 to 2016 of Jamaica. No data until 1960. Number of actual observations by date: 56.
Source name:
World Development Indicators
Source organization:
International Monetary Fund, International Financial Statistics and data files, and World Bank and OECD GDP estimates.
Categories, topics:
Financial Sector
Last updated:
apr 23, 2017
Indicators value changes by year
Maximum:
94.198
jan 1, 1984
At the date of observation
Value
Absolute change
Change from previous value
jan 1, 1961
9.453
+9.453
0.0%
jan 1, 1962
16.653
+7.201
76.18%
jan 1, 1963
18.374
+1.721
10.33%
jan 1, 1964
16.497
-1.877
-10.22%
jan 1, 1965
20.329
+3.832
23.23%
jan 1, 1966
22.039
+1.71
8.41%
jan 1, 1967
19.484
-2.555
-11.59%
jan 1, 1968
20.73
+1.245
6.39%
jan 1, 1969
22.847
+2.117
10.21%
jan 1, 1970
27.058
+4.211
18.43%
jan 1, 1971
27.683
+0.626
2.31%
jan 1, 1972
30.305
+2.622
9.47%
jan 1, 1973
36.652
+6.347
20.94%
jan 1, 1974
41.273
+4.621
12.61%
jan 1, 1975
38.396
-2.877
-6.97%
jan 1, 1976
42.943
+4.547
11.84%
jan 1, 1977
50.37
+7.427
17.29%
jan 1, 1978
50.593
+0.223
0.44%
jan 1, 1979
50.594
+0.001
0.0%
jan 1, 1980
63.575
+12.98
25.66%
jan 1, 1981
62.518
-1.057
-1.66%
jan 1, 1982
75.063
+12.545
20.07%
jan 1, 1983
87.066
+12.004
15.99%
jan 1, 1984
94.198
+7.131
8.19%
jan 1, 1985
76.939
-17.258
-18.32%
jan 1, 1986
66.692
-10.247
-13.32%
jan 1, 1987
66.173
-0.519
-0.78%
jan 1, 1988
54.434
-11.739
-17.74%
jan 1, 1989
55.781
+1.347
2.47%
jan 1, 1990
54.575
-1.206
-2.16%
jan 1, 1991
45.753
-8.821
-16.16%
jan 1, 1992
37.062
-8.691
-19.0%
jan 1, 1993
30.71
-6.352
-17.14%
jan 1, 1994
28.529
-2.181
-7.1%
jan 1, 1995
25.891
-2.638
-9.25%
jan 1, 1996
30.666
+4.775
18.44%
jan 1, 1997
37.474
+6.808
22.2%
jan 1, 1998
44.899
+7.425
19.81%
jan 1, 1999
45.837
+0.939
2.09%
jan 1, 2000
47.871
+2.034
4.44%
jan 1, 2001
46.541
-1.331
-2.78%
jan 1, 2002
57.821
+11.281
24.24%
jan 1, 2003
56.992
-0.829
-1.43%
jan 1, 2004
63.32
+6.328
11.1%
jan 1, 2005
57.569
-5.751
-9.08%
jan 1, 2006
56.096
-1.473
-2.56%
jan 1, 2007
53.695
-2.401
-4.28%
jan 1, 2008
52.701
-0.994
-1.85%
jan 1, 2009
57.707
+5.007
9.5%
jan 1, 2010
60.077
+2.37
4.11%
jan 1, 2011
51.148
-8.928
-14.86%
jan 1, 2012
49.654
-1.494
-2.92%
jan 1, 2013
51.792
+2.138
4.31%
jan 1, 2014
51.755
-0.038
-0.07%
jan 1, 2015
52.515
+0.761
1.47%
jan 1, 2016
49.538
-2.978
-5.67%
Ranking of countries by current statistics by years


Comments: