29
/
en
AIzaSyAYiBZKx7MnpbEhh9jyipgxe19OcubqV5w
April 1, 2024
207799
Netherlands
NLD
true
2
1
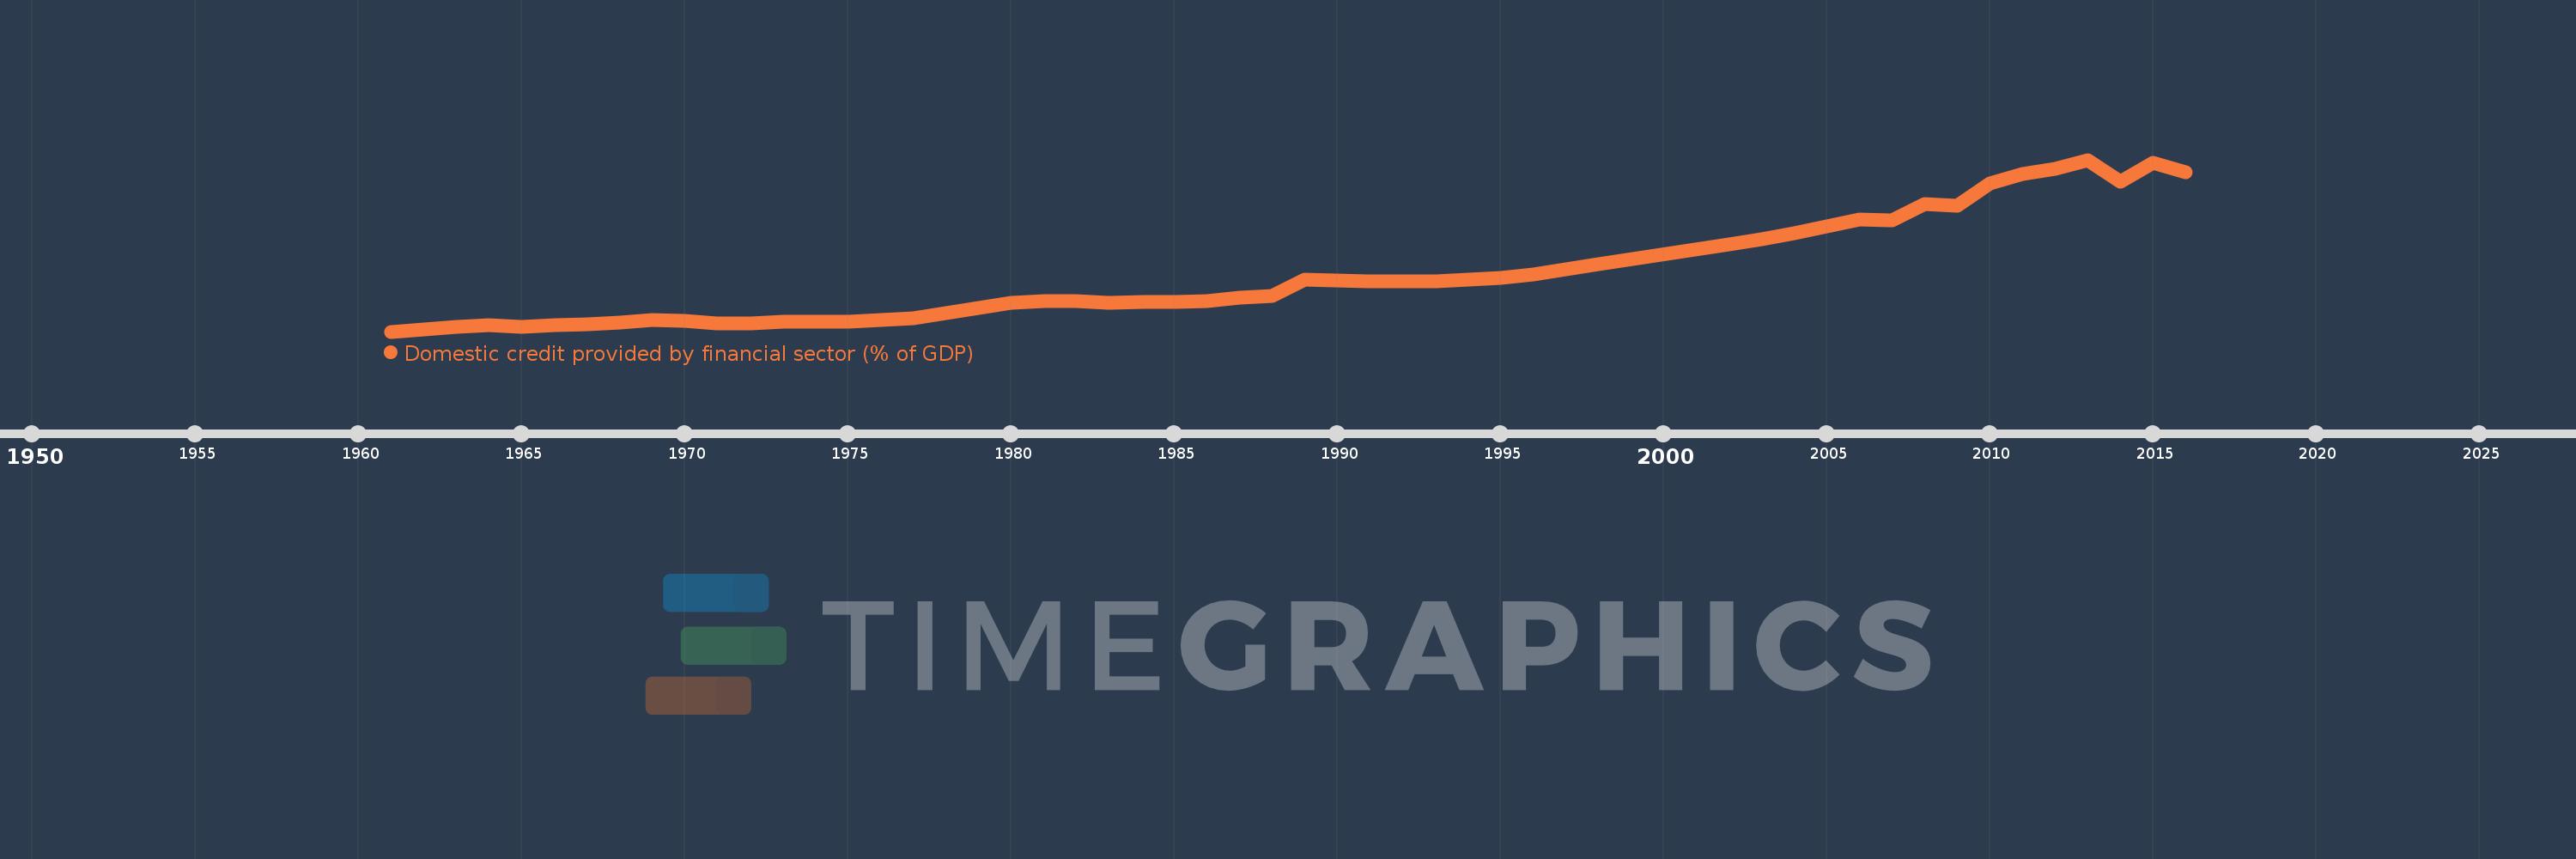
Domestic credit provided by financial sector (% of GDP)
2016,2015,2014,2013,2012,2011,2010,2009,2008,2007,2006,2005,2004,2003,2002,1998,1997,1996,1995,1994,1993,1992,1991,1990,1989,1988,1987,1986,1985,1984,1983,1982,1981,1980,1979,1978,1977,1976,1975,1974,1973,1972,1971,1970,1969,1968,1967,1966,1965,1964,1963,1962,1961
This statistics in other country:
AfghanistanAlbaniaAlgeriaAngolaAntigua and BarbudaArab WorldArgentinaArmeniaArubaAustraliaAustriaAzerbaijanBahamas, TheBahrainBangladeshBarbadosBelarusBelgiumBelizeBeninBhutanBoliviaBosnia and HerzegovinaBotswanaBrazilBrunei DarussalamBulgariaBurkina FasoBurundiCabo VerdeCambodiaCameroonCanadaCaribbean small statesCentral African RepublicCentral Europe and the BalticsChadChileChinaColombiaComorosCongo, Dem. Rep.Congo, Rep.Costa RicaCote d'IvoireCroatiaCyprusCzech RepublicDenmarkDjiboutiDominicaDominican RepublicEarly-demographic dividendEast Asia & PacificEast Asia & Pacific (excluding high income)East Asia & Pacific (IDA & IBRD countries)EcuadorEgypt, Arab Rep.El SalvadorEquatorial GuineaEritreaEstoniaEthiopiaEuro areaEurope & Central AsiaEurope & Central Asia (excluding high income)Europe & Central Asia (IDA & IBRD countries)European UnionFijiFinlandFragile and conflict affected situationsFranceGabonGambia, TheGeorgiaGermanyGhanaGreeceGrenadaGuatemalaGuineaGuinea-BissauGuyanaHaitiHeavily indebted poor countries (HIPC)High incomeHondurasHong Kong SAR, ChinaHungaryIBRD onlyIcelandIDA & IBRD totalIDA blendIDA onlyIDA totalIndiaIndonesiaIran, Islamic Rep.IraqIrelandIsraelItalyJamaicaJapanJordanKazakhstanKenyaKorea, Rep.KosovoKuwaitKyrgyz RepublicLao PDRLate-demographic dividendLatin America & Caribbean Latin America & Caribbean (excluding high income)Latin America & the Caribbean (IDA & IBRD countries)LatviaLeast developed countries: UN classificationLebanonLesothoLiberiaLibyaLithuaniaLow & middle incomeLow incomeLower middle incomeLuxembourgMacao SAR, ChinaMacedonia, FYRMadagascarMalawiMalaysiaMaldivesMaliMaltaMauritaniaMauritiusMexicoMicronesia, Fed. Sts.Middle East & North AfricaMiddle East & North Africa (excluding high income)Middle East & North Africa (IDA & IBRD countries)Middle incomeMoldovaMongoliaMontenegroMoroccoMozambiqueMyanmarNamibiaNepalNetherlandsNew ZealandNicaraguaNigerNigeriaNorth AmericaNorwayOECD membersOmanOther small statesPacific island small statesPakistanPanamaPapua New GuineaParaguayPeruPhilippinesPolandPortugalPost-demographic dividendPre-demographic dividendQatarRomaniaRussian FederationRwandaSamoaSao Tome and PrincipeSaudi ArabiaSenegalSerbiaSeychellesSierra LeoneSingaporeSlovak RepublicSloveniaSmall statesSolomon IslandsSouth AfricaSouth AsiaSouth Asia (IDA & IBRD)South SudanSpainSri LankaSt. Kitts and NevisSt. LuciaSt. Vincent and the GrenadinesSub-Saharan Africa Sub-Saharan Africa (excluding high income)Sub-Saharan Africa (IDA & IBRD countries)SudanSurinameSwazilandSwedenSwitzerlandSyrian Arab RepublicTajikistanTanzaniaThailandTimor-LesteTogoTongaTrinidad and TobagoTunisiaTurkeyUgandaUkraineUnited Arab EmiratesUnited KingdomUnited StatesUpper middle incomeUruguayVanuatuVenezuela, RBVietnamWest Bank and GazaWorldYemen, Rep.ZambiaZimbabwe Timeline:
This timeline shows a graph from 1961 to 2016 of Netherlands. No data until 1960. Number of actual observations by date: 53.
Source name:
World Development Indicators
Source organization:
International Monetary Fund, International Financial Statistics and data files, and World Bank and OECD GDP estimates.
Categories, topics:
Financial Sector
Last updated:
apr 23, 2017
Indicators value changes by year
Minimum:
39.683
jan 1, 1961
Maximum:
234.016
jan 1, 2013
At the date of observation
Value
Absolute change
Change from previous value
jan 1, 1961
39.683
+39.683
0.0%
jan 1, 1962
41.969
+2.286
5.76%
jan 1, 1963
45.095
+3.126
7.45%
jan 1, 1964
46.761
+1.665
3.69%
jan 1, 1965
45.335
-1.426
-3.05%
jan 1, 1966
46.771
+1.436
3.17%
jan 1, 1967
47.67
+0.899
1.92%
jan 1, 1968
50.323
+2.653
5.56%
jan 1, 1969
52.462
+2.139
4.25%
jan 1, 1970
52.242
-0.22
-0.42%
jan 1, 1971
48.745
-3.497
-6.69%
jan 1, 1972
48.573
-0.173
-0.35%
jan 1, 1973
50.489
+1.916
3.94%
jan 1, 1974
51.212
+0.723
1.43%
jan 1, 1975
50.372
-0.84
-1.64%
jan 1, 1976
52.73
+2.358
4.68%
jan 1, 1977
54.32
+1.59
3.02%
jan 1, 1978
60.408
+6.089
11.21%
jan 1, 1979
66.878
+6.469
10.71%
jan 1, 1980
72.127
+5.25
7.85%
jan 1, 1981
73.901
+1.774
2.46%
jan 1, 1982
74.023
+0.122
0.17%
jan 1, 1983
72.156
-1.867
-2.52%
jan 1, 1984
73.064
+0.908
1.26%
jan 1, 1985
72.821
-0.243
-0.33%
jan 1, 1986
73.925
+1.104
1.52%
jan 1, 1987
77.671
+3.746
5.07%
jan 1, 1988
80.291
+2.621
3.37%
jan 1, 1989
98.072
+17.781
22.15%
jan 1, 1990
97.383
-0.689
-0.7%
jan 1, 1991
96.984
-0.399
-0.41%
jan 1, 1992
96.448
-0.535
-0.55%
jan 1, 1993
96.498
+0.05
0.05%
jan 1, 1994
98.594
+2.095
2.17%
jan 1, 1995
100.204
+1.61
1.63%
jan 1, 1996
104.491
+4.287
4.28%
jan 1, 1997
109.679
+5.187
4.96%
jan 1, 1998
115.878
+6.199
5.65%
jan 1, 2002
138.488
+22.61
19.51%
jan 1, 2003
144.017
+5.529
3.99%
jan 1, 2004
150.803
+6.787
4.71%
jan 1, 2005
159.128
+8.325
5.52%
jan 1, 2006
166.212
+7.085
4.45%
jan 1, 2007
165.741
-0.472
-0.28%
jan 1, 2008
184.208
+18.467
11.14%
jan 1, 2009
182.292
-1.915
-1.04%
jan 1, 2010
207.232
+24.94
13.68%
jan 1, 2011
218.268
+11.036
5.33%
jan 1, 2012
224.034
+5.766
2.64%
jan 1, 2013
234.016
+9.982
4.46%
jan 1, 2014
209.355
-24.661
-10.54%
jan 1, 2015
230.614
+21.259
10.15%
jan 1, 2016
219.531
-11.083
-4.81%
Ranking of countries by current statistics by years


Comments: