29
/
en
AIzaSyAYiBZKx7MnpbEhh9jyipgxe19OcubqV5w
April 1, 2024
58838
Sub-Saharan Africa
SSF
false
2
1
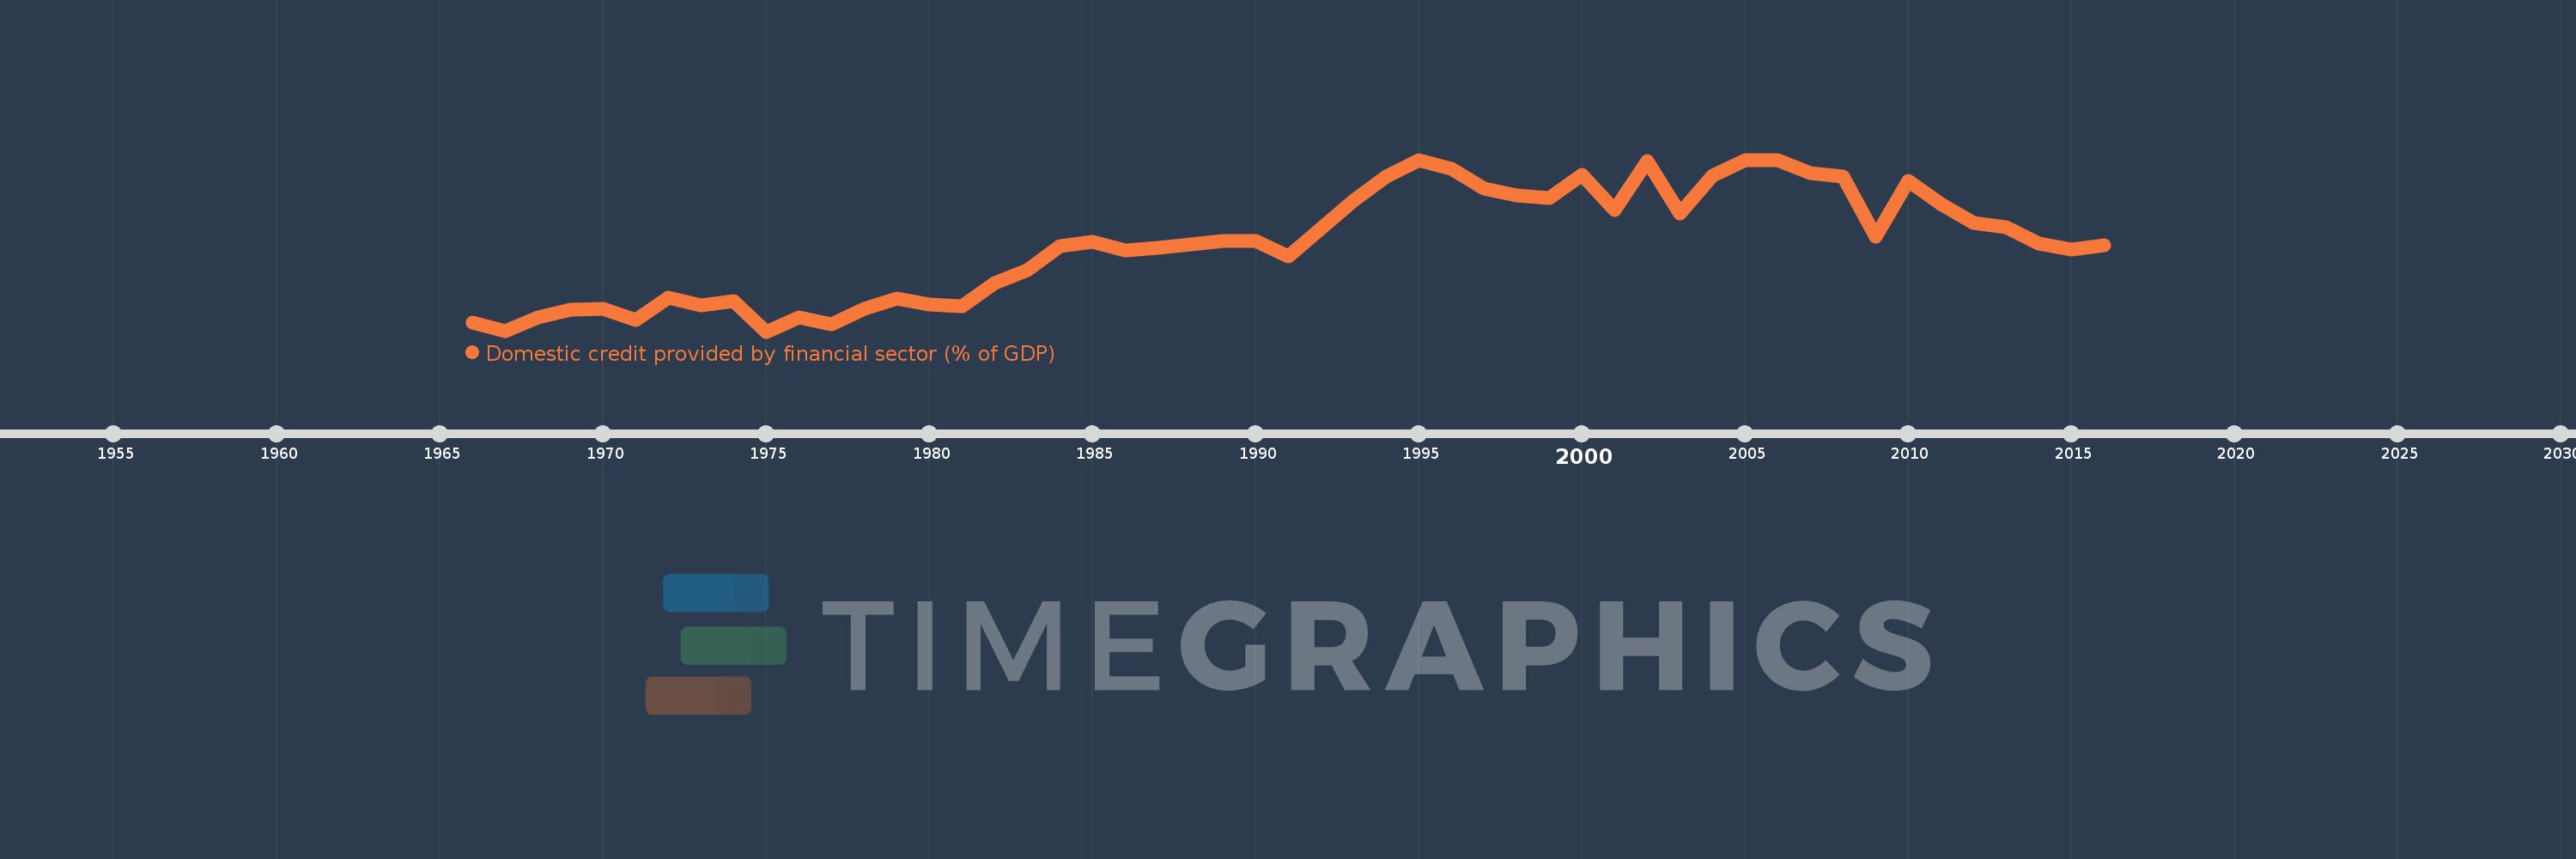
Domestic credit provided by financial sector (% of GDP)
2016,2015,2014,2013,2012,2011,2010,2009,2008,2007,2006,2005,2004,2003,2002,2001,2000,1999,1998,1997,1996,1995,1994,1993,1991,1990,1989,1988,1987,1986,1985,1984,1983,1982,1981,1980,1979,1978,1977,1976,1975,1974,1973,1972,1971,1970,1969,1968,1967,1966
This statistics in other country:
AfghanistanAlbaniaAlgeriaAngolaAntigua and BarbudaArab WorldArgentinaArmeniaArubaAustraliaAustriaAzerbaijanBahamas, TheBahrainBangladeshBarbadosBelarusBelgiumBelizeBeninBhutanBoliviaBosnia and HerzegovinaBotswanaBrazilBrunei DarussalamBulgariaBurkina FasoBurundiCabo VerdeCambodiaCameroonCanadaCaribbean small statesCentral African RepublicCentral Europe and the BalticsChadChileChinaColombiaComorosCongo, Dem. Rep.Congo, Rep.Costa RicaCote d'IvoireCroatiaCyprusCzech RepublicDenmarkDjiboutiDominicaDominican RepublicEarly-demographic dividendEast Asia & PacificEast Asia & Pacific (excluding high income)East Asia & Pacific (IDA & IBRD countries)EcuadorEgypt, Arab Rep.El SalvadorEquatorial GuineaEritreaEstoniaEthiopiaEuro areaEurope & Central AsiaEurope & Central Asia (excluding high income)Europe & Central Asia (IDA & IBRD countries)European UnionFijiFinlandFragile and conflict affected situationsFranceGabonGambia, TheGeorgiaGermanyGhanaGreeceGrenadaGuatemalaGuineaGuinea-BissauGuyanaHaitiHeavily indebted poor countries (HIPC)High incomeHondurasHong Kong SAR, ChinaHungaryIBRD onlyIcelandIDA & IBRD totalIDA blendIDA onlyIDA totalIndiaIndonesiaIran, Islamic Rep.IraqIrelandIsraelItalyJamaicaJapanJordanKazakhstanKenyaKorea, Rep.KosovoKuwaitKyrgyz RepublicLao PDRLate-demographic dividendLatin America & Caribbean Latin America & Caribbean (excluding high income)Latin America & the Caribbean (IDA & IBRD countries)LatviaLeast developed countries: UN classificationLebanonLesothoLiberiaLibyaLithuaniaLow & middle incomeLow incomeLower middle incomeLuxembourgMacao SAR, ChinaMacedonia, FYRMadagascarMalawiMalaysiaMaldivesMaliMaltaMauritaniaMauritiusMexicoMicronesia, Fed. Sts.Middle East & North AfricaMiddle East & North Africa (excluding high income)Middle East & North Africa (IDA & IBRD countries)Middle incomeMoldovaMongoliaMontenegroMoroccoMozambiqueMyanmarNamibiaNepalNetherlandsNew ZealandNicaraguaNigerNigeriaNorth AmericaNorwayOECD membersOmanOther small statesPacific island small statesPakistanPanamaPapua New GuineaParaguayPeruPhilippinesPolandPortugalPost-demographic dividendPre-demographic dividendQatarRomaniaRussian FederationRwandaSamoaSao Tome and PrincipeSaudi ArabiaSenegalSerbiaSeychellesSierra LeoneSingaporeSlovak RepublicSloveniaSmall statesSolomon IslandsSouth AfricaSouth AsiaSouth Asia (IDA & IBRD)South SudanSpainSri LankaSt. Kitts and NevisSt. LuciaSt. Vincent and the GrenadinesSub-Saharan Africa Sub-Saharan Africa (excluding high income)Sub-Saharan Africa (IDA & IBRD countries)SudanSurinameSwazilandSwedenSwitzerlandSyrian Arab RepublicTajikistanTanzaniaThailandTimor-LesteTogoTongaTrinidad and TobagoTunisiaTurkeyUgandaUkraineUnited Arab EmiratesUnited KingdomUnited StatesUpper middle incomeUruguayVanuatuVenezuela, RBVietnamWest Bank and GazaWorldYemen, Rep.ZambiaZimbabwe Timeline:
This timeline shows a graph from 1966 to 2016 of Sub-Saharan Africa . No data until 1965. Number of actual observations by date: 50.
Source name:
World Development Indicators
Source organization:
International Monetary Fund, International Financial Statistics and data files, and World Bank and OECD GDP estimates.
Categories, topics:
Financial Sector
Last updated:
apr 23, 2017
Indicators value changes by year
Minimum:
38.381
jan 1, 1975
Maximum:
77.943
jan 1, 1995
At the date of observation
Value
Absolute change
Change from previous value
jan 1, 1966
40.455
+40.455
0.0%
jan 1, 1967
38.394
-2.061
-5.09%
jan 1, 1968
41.667
+3.273
8.52%
jan 1, 1969
43.409
+1.742
4.18%
jan 1, 1970
43.644
+0.235
0.54%
jan 1, 1971
41.133
-2.511
-5.75%
jan 1, 1972
46.098
+4.965
12.07%
jan 1, 1973
44.437
-1.661
-3.6%
jan 1, 1974
45.348
+0.91
2.05%
jan 1, 1975
38.381
-6.967
-15.36%
jan 1, 1976
41.718
+3.337
8.69%
jan 1, 1977
40.104
-1.614
-3.87%
jan 1, 1978
43.716
+3.612
9.01%
jan 1, 1979
46.09
+2.374
5.43%
jan 1, 1980
44.547
-1.543
-3.35%
jan 1, 1981
44.136
-0.411
-0.92%
jan 1, 1982
49.463
+5.327
12.07%
jan 1, 1983
52.459
+2.997
6.06%
jan 1, 1984
58.134
+5.674
10.82%
jan 1, 1985
59.051
+0.917
1.58%
jan 1, 1986
57.023
-2.028
-3.43%
jan 1, 1987
57.68
+0.657
1.15%
jan 1, 1988
58.489
+0.809
1.4%
jan 1, 1989
59.196
+0.707
1.21%
jan 1, 1990
59.306
+0.111
0.19%
jan 1, 1991
55.722
-3.584
-6.04%
jan 1, 1993
68.615
+12.893
23.14%
jan 1, 1994
74.071
+5.457
7.95%
jan 1, 1995
77.943
+3.871
5.23%
jan 1, 1996
75.876
-2.067
-2.65%
jan 1, 1997
71.402
-4.473
-5.9%
jan 1, 1998
69.713
-1.689
-2.37%
jan 1, 1999
69.113
-0.6
-0.86%
jan 1, 2000
74.441
+5.329
7.71%
jan 1, 2001
66.383
-8.058
-10.82%
jan 1, 2002
77.617
+11.234
16.92%
jan 1, 2003
65.521
-12.096
-15.58%
jan 1, 2004
74.313
+8.792
13.42%
jan 1, 2005
77.912
+3.599
4.84%
jan 1, 2006
77.813
-0.098
-0.13%
jan 1, 2007
74.838
-2.975
-3.82%
jan 1, 2008
74.136
-0.702
-0.94%
jan 1, 2009
60.19
-13.946
-18.81%
jan 1, 2010
73.072
+12.882
21.4%
jan 1, 2011
67.837
-5.236
-7.17%
jan 1, 2012
63.405
-4.432
-6.53%
jan 1, 2013
62.367
-1.038
-1.64%
jan 1, 2014
58.676
-3.691
-5.92%
jan 1, 2015
57.229
-1.446
-2.46%
jan 1, 2016
58.284
+1.054
1.84%
Ranking of countries by current statistics by years


Comments: