29
/
en
AIzaSyAYiBZKx7MnpbEhh9jyipgxe19OcubqV5w
April 1, 2024
223406
Philippines
PHL
true
2
1
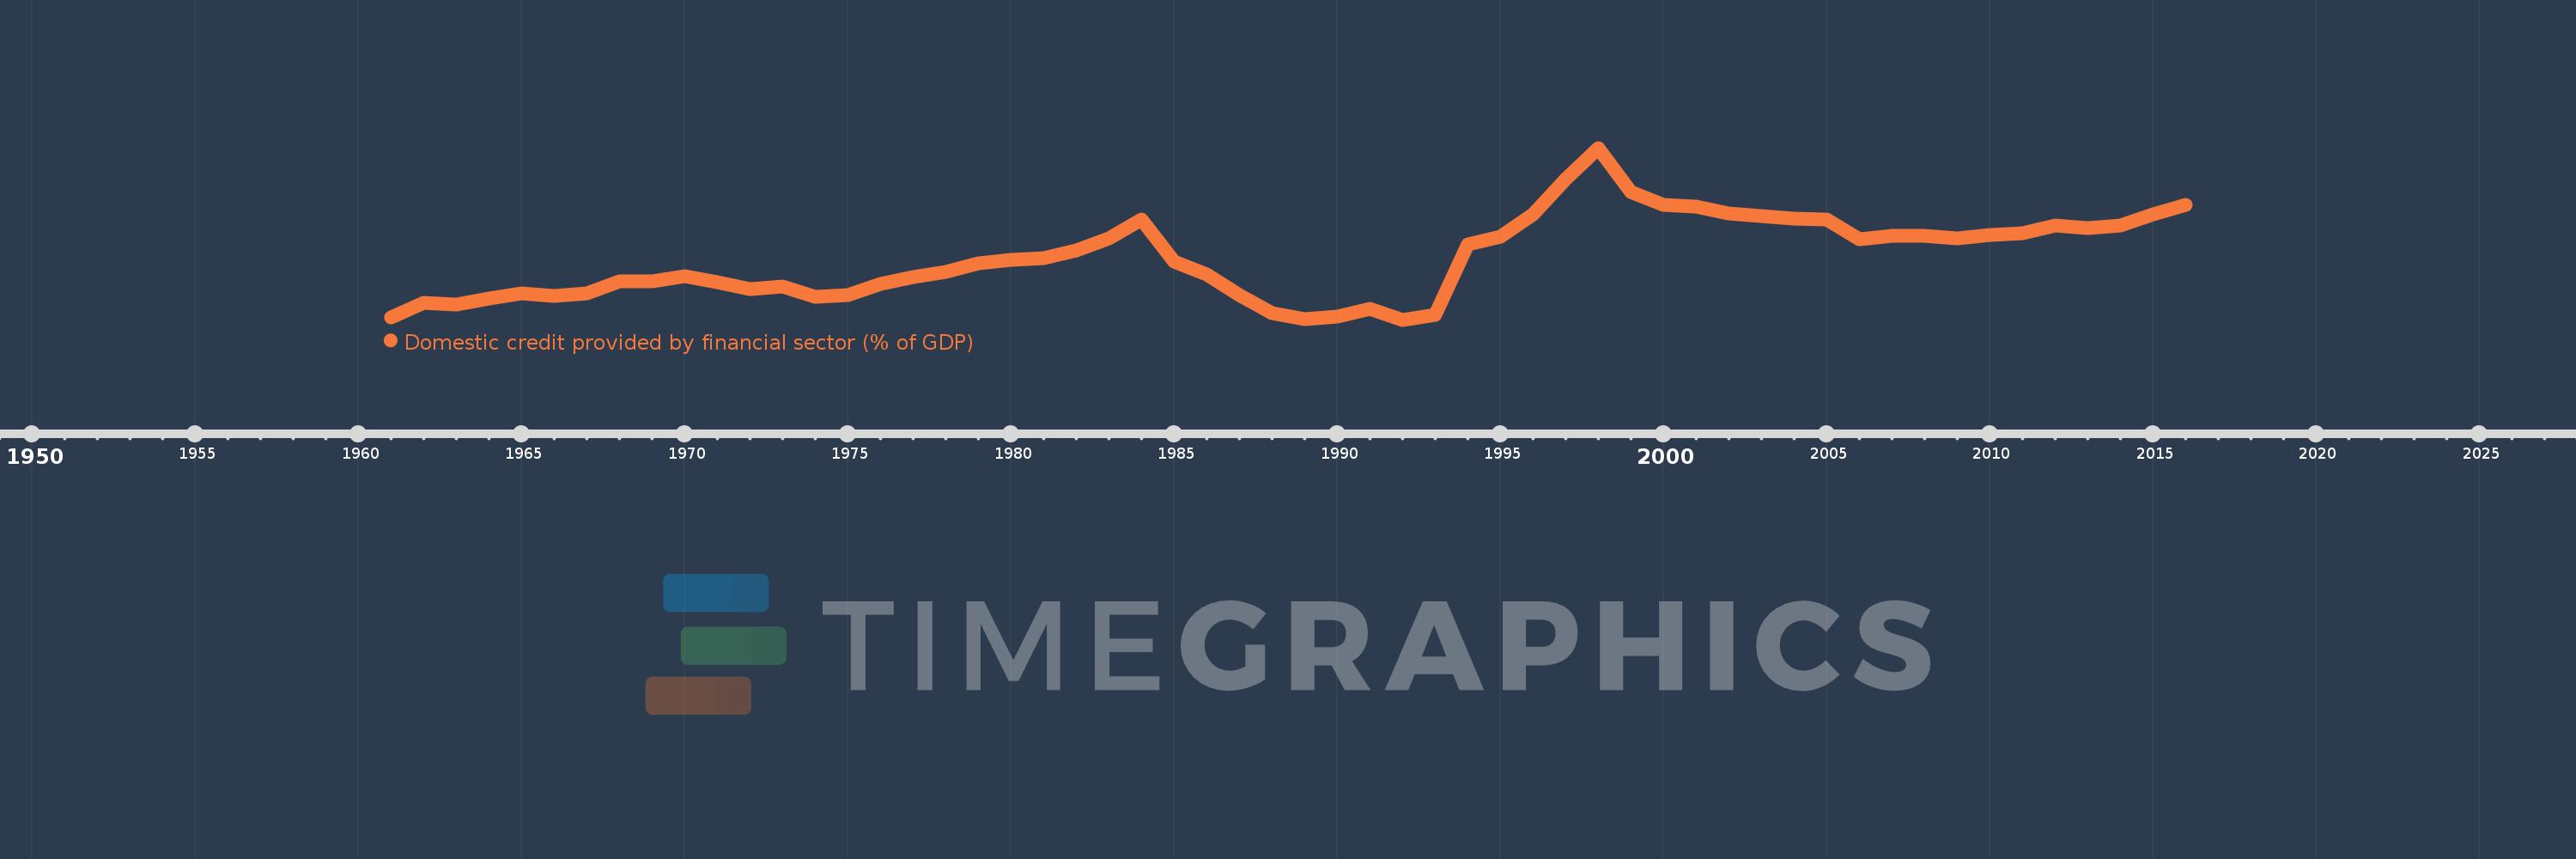
Domestic credit provided by financial sector (% of GDP)
2016,2015,2014,2013,2012,2011,2010,2009,2008,2007,2006,2005,2004,2003,2002,2001,2000,1999,1998,1997,1996,1995,1994,1993,1992,1991,1990,1989,1988,1987,1986,1985,1984,1983,1982,1981,1980,1979,1978,1977,1976,1975,1974,1973,1972,1971,1970,1969,1968,1967,1966,1965,1964,1963,1962,1961
This statistics in other country:
AfghanistanAlbaniaAlgeriaAngolaAntigua and BarbudaArab WorldArgentinaArmeniaArubaAustraliaAustriaAzerbaijanBahamas, TheBahrainBangladeshBarbadosBelarusBelgiumBelizeBeninBhutanBoliviaBosnia and HerzegovinaBotswanaBrazilBrunei DarussalamBulgariaBurkina FasoBurundiCabo VerdeCambodiaCameroonCanadaCaribbean small statesCentral African RepublicCentral Europe and the BalticsChadChileChinaColombiaComorosCongo, Dem. Rep.Congo, Rep.Costa RicaCote d'IvoireCroatiaCyprusCzech RepublicDenmarkDjiboutiDominicaDominican RepublicEarly-demographic dividendEast Asia & PacificEast Asia & Pacific (excluding high income)East Asia & Pacific (IDA & IBRD countries)EcuadorEgypt, Arab Rep.El SalvadorEquatorial GuineaEritreaEstoniaEthiopiaEuro areaEurope & Central AsiaEurope & Central Asia (excluding high income)Europe & Central Asia (IDA & IBRD countries)European UnionFijiFinlandFragile and conflict affected situationsFranceGabonGambia, TheGeorgiaGermanyGhanaGreeceGrenadaGuatemalaGuineaGuinea-BissauGuyanaHaitiHeavily indebted poor countries (HIPC)High incomeHondurasHong Kong SAR, ChinaHungaryIBRD onlyIcelandIDA & IBRD totalIDA blendIDA onlyIDA totalIndiaIndonesiaIran, Islamic Rep.IraqIrelandIsraelItalyJamaicaJapanJordanKazakhstanKenyaKorea, Rep.KosovoKuwaitKyrgyz RepublicLao PDRLate-demographic dividendLatin America & Caribbean Latin America & Caribbean (excluding high income)Latin America & the Caribbean (IDA & IBRD countries)LatviaLeast developed countries: UN classificationLebanonLesothoLiberiaLibyaLithuaniaLow & middle incomeLow incomeLower middle incomeLuxembourgMacao SAR, ChinaMacedonia, FYRMadagascarMalawiMalaysiaMaldivesMaliMaltaMauritaniaMauritiusMexicoMicronesia, Fed. Sts.Middle East & North AfricaMiddle East & North Africa (excluding high income)Middle East & North Africa (IDA & IBRD countries)Middle incomeMoldovaMongoliaMontenegroMoroccoMozambiqueMyanmarNamibiaNepalNetherlandsNew ZealandNicaraguaNigerNigeriaNorth AmericaNorwayOECD membersOmanOther small statesPacific island small statesPakistanPanamaPapua New GuineaParaguayPeruPhilippinesPolandPortugalPost-demographic dividendPre-demographic dividendQatarRomaniaRussian FederationRwandaSamoaSao Tome and PrincipeSaudi ArabiaSenegalSerbiaSeychellesSierra LeoneSingaporeSlovak RepublicSloveniaSmall statesSolomon IslandsSouth AfricaSouth AsiaSouth Asia (IDA & IBRD)South SudanSpainSri LankaSt. Kitts and NevisSt. LuciaSt. Vincent and the GrenadinesSub-Saharan Africa Sub-Saharan Africa (excluding high income)Sub-Saharan Africa (IDA & IBRD countries)SudanSurinameSwazilandSwedenSwitzerlandSyrian Arab RepublicTajikistanTanzaniaThailandTimor-LesteTogoTongaTrinidad and TobagoTunisiaTurkeyUgandaUkraineUnited Arab EmiratesUnited KingdomUnited StatesUpper middle incomeUruguayVanuatuVenezuela, RBVietnamWest Bank and GazaWorldYemen, Rep.ZambiaZimbabwe Timeline:
This timeline shows a graph from 1961 to 2016 of Philippines. No data until 1960. Number of actual observations by date: 56.
Source name:
World Development Indicators
Source organization:
International Monetary Fund, International Financial Statistics and data files, and World Bank and OECD GDP estimates.
Categories, topics:
Financial Sector
Last updated:
apr 23, 2017
Indicators value changes by year
Maximum:
78.543
jan 1, 1998
At the date of observation
Value
Absolute change
Change from previous value
jan 1, 1961
20.26
+20.26
0.0%
jan 1, 1962
25.366
+5.106
25.2%
jan 1, 1963
24.836
-0.53
-2.09%
jan 1, 1964
26.774
+1.938
7.8%
jan 1, 1965
28.577
+1.803
6.74%
jan 1, 1966
27.731
-0.846
-2.96%
jan 1, 1967
28.586
+0.855
3.08%
jan 1, 1968
32.774
+4.187
14.65%
jan 1, 1969
32.755
-0.019
-0.06%
jan 1, 1970
34.465
+1.71
5.22%
jan 1, 1971
32.437
-2.028
-5.88%
jan 1, 1972
30.099
-2.337
-7.21%
jan 1, 1973
30.84
+0.741
2.46%
jan 1, 1974
27.37
-3.471
-11.25%
jan 1, 1975
27.95
+0.58
2.12%
jan 1, 1976
31.811
+3.861
13.81%
jan 1, 1977
34.232
+2.421
7.61%
jan 1, 1978
35.927
+1.694
4.95%
jan 1, 1979
38.843
+2.916
8.12%
jan 1, 1980
40.108
+1.265
3.26%
jan 1, 1981
40.638
+0.53
1.32%
jan 1, 1982
43.376
+2.738
6.74%
jan 1, 1983
47.6
+4.225
9.74%
jan 1, 1984
53.871
+6.271
13.17%
jan 1, 1985
39.399
-14.472
-26.86%
jan 1, 1986
34.994
-4.405
-11.18%
jan 1, 1987
28.027
-6.967
-19.91%
jan 1, 1988
21.723
-6.304
-22.49%
jan 1, 1989
19.714
-2.01
-9.25%
jan 1, 1990
20.684
+0.97
4.92%
jan 1, 1991
23.233
+2.549
12.33%
jan 1, 1992
19.54
-3.693
-15.89%
jan 1, 1993
21.221
+1.681
8.6%
jan 1, 1994
45.415
+24.194
114.01%
jan 1, 1995
48.048
+2.632
5.8%
jan 1, 1996
55.74
+7.692
16.01%
jan 1, 1997
67.921
+12.181
21.85%
jan 1, 1998
78.543
+10.622
15.64%
jan 1, 1999
63.278
-15.265
-19.44%
jan 1, 2000
58.931
-4.347
-6.87%
jan 1, 2001
58.335
-0.595
-1.01%
jan 1, 2002
56.056
-2.279
-3.91%
jan 1, 2003
55.094
-0.963
-1.72%
jan 1, 2004
54.337
-0.756
-1.37%
jan 1, 2005
53.981
-0.356
-0.66%
jan 1, 2006
47.247
-6.734
-12.48%
jan 1, 2007
48.248
+1.002
2.12%
jan 1, 2008
48.346
+0.098
0.2%
jan 1, 2009
47.443
-0.903
-1.87%
jan 1, 2010
48.715
+1.272
2.68%
jan 1, 2011
49.232
+0.517
1.06%
jan 1, 2012
51.98
+2.748
5.58%
jan 1, 2013
50.899
-1.082
-2.08%
jan 1, 2014
51.902
+1.004
1.97%
jan 1, 2015
55.808
+3.906
7.53%
jan 1, 2016
59.073
+3.265
5.85%
Ranking of countries by current statistics by years


Comments: